Why Should Prospects, Clients, Partners, Goals, and Tasks Live in One Relationship Graph?
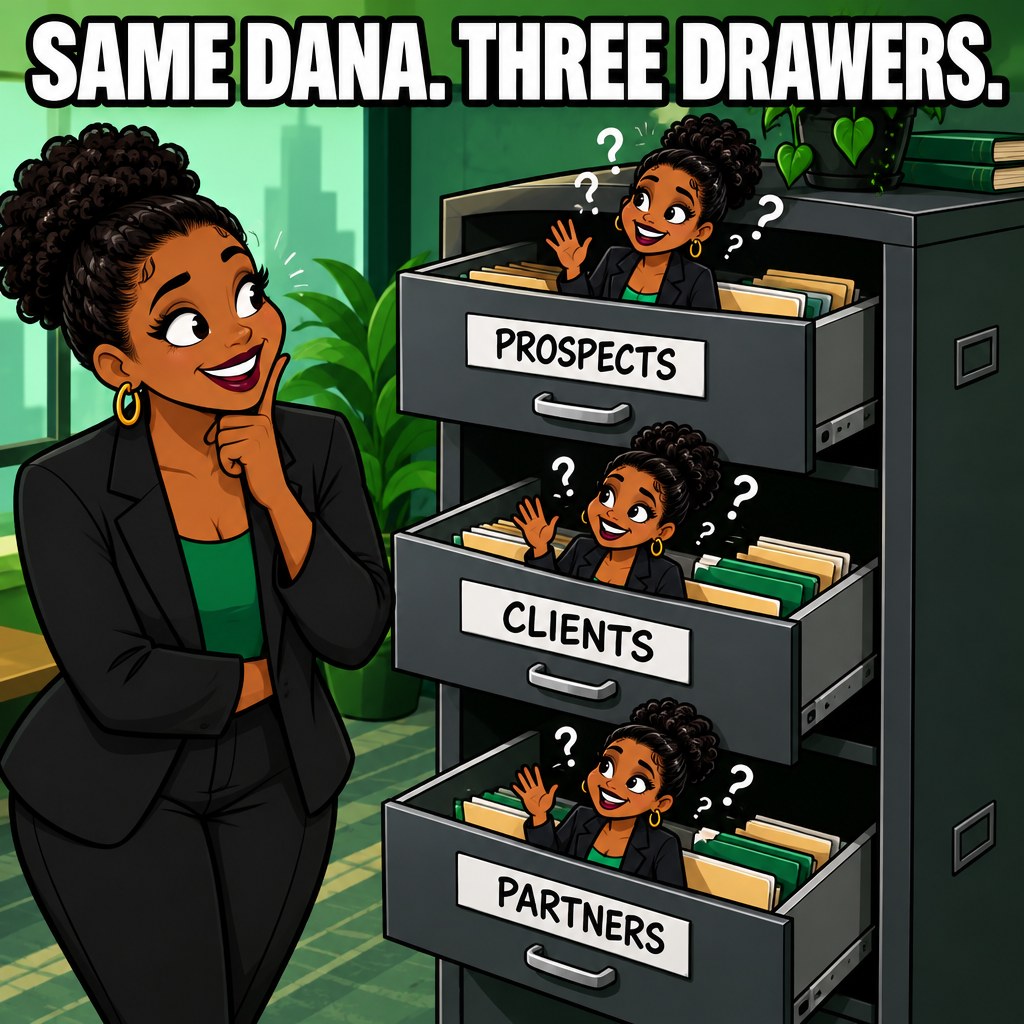
The same person moves from prospect to client to partner. Split them across lists and you can't see who actually feeds your business, or that referred customers are worth more.

Short Answer
Because in a small business, the same person plays different roles over time, and the money is in the connections between those roles. A broker starts as a prospect, becomes a client, then sends you three referrals, which makes her a partner. Store those in three separate lists and your system sees three unrelated rows. It will never tell you she's your best source of business. It will never connect the goal you set for her account to the tasks on your calendar. Keep them in one graph and "who actually feeds my business?" becomes a question with an answer. The research says that answer is worth money: in a well-known study, referred customers were worth 16–25% more than comparable customers and stayed longer.
Meet Dana (Three Times)
Here's a story I see constantly, told the way most small-business tools would record it.
In January, you meet Dana at a chamber of commerce mixer. She runs a four-agent real-estate brokerage. She goes into your prospect list (or your phone).
In March, she signs on. You do the work. Now she's in your client records, invoicing, and project folder. Maybe a new row. Maybe a new app.
By summer, Dana has referred you to two other brokers and a property manager. One of those brokers introduces you to an electrician who, it turns out, is great at finding you work too. Those four people land in the prospect list as brand-new rows, with "source: referral" if you're lucky and nothing if you're busy.
Now ask your business three questions:
- Who's my best source of new clients?
- How much revenue has Dana generated for me, including referrals?
- What's the next step on the goal I set for Dana's account, and is it on my calendar?
With separate lists, the honest answer to all three is "let me think about it." The data exists. It's just spread out, with no connections between the pieces.
Roles Change. Identities Don't.
The core design mistake in most small-business software is treating prospect, client, and partner as different kinds of things, each with its own table. They aren't. They're roles a relationship moves through. The person and the organization stay the same.
Here's how the Operator OS models it, and why each piece exists:
open_with Drag nodes to rearrange, tap one for the evidence behind it — pinch or scroll to zoom.
Three design rules are doing the heavy lifting:
- Identity first. Organizations and people exist once. A new lead from a scraper, a referral, or a handshake gets matched against who you already know before it becomes a new record.
- Roles are states, not tables. "Prospect," "Client," and "Partner" are filters on relationships. Your cockpit can still have three tabs, as three views of one memory.
- Execution stays global. A task created under Dana's goal isn't trapped inside her profile. It shows up in your daily timebox next to everything else, so the relationship actually gets your time.
Why the Connections Are Where the Money Is
Referred customers are worth more
This is one of the better-studied findings in marketing. Philipp Schmitt, Bernd Skiera, and Christophe Van den Bulte tracked about 10,000 customers of a German bank for nearly three years (Journal of Marketing, 2011). Customers who came in through referrals had:
- higher contribution margins (the gap shrank over time)
- higher retention (the gap persisted)
- a customer value 16% to 25% higher than comparable non-referred customers acquired at the same time
It's a bank, not a contracting business, and I won't pretend otherwise. But the mechanism is universal: a referral carries trust, and trust keeps customers. Nielsen's 2015 global survey found 83% of people trust recommendations from friends and family, more than any form of advertising.
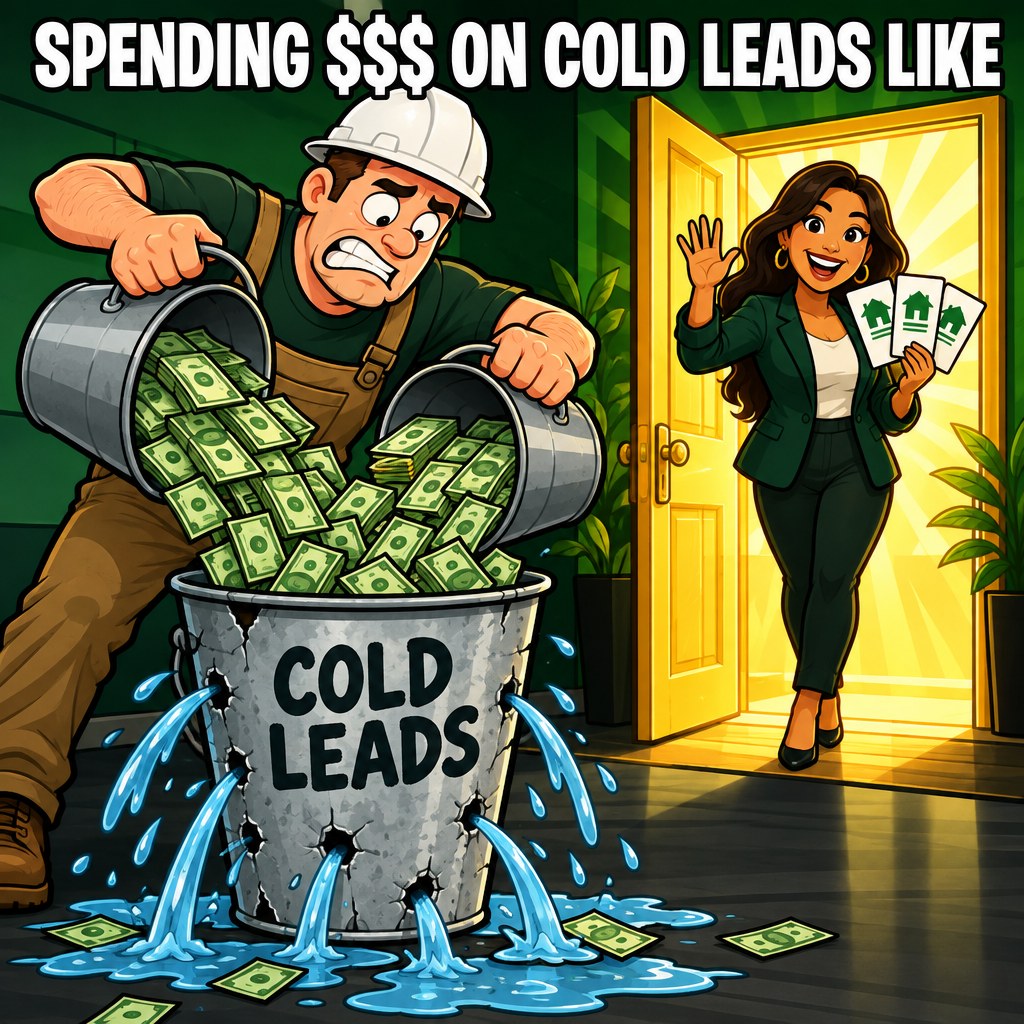
Here's the problem: if your system can't connect Dana to the three people she sent you, you can't see that value, so you can't protect it. You'll spend money chasing cold leads while the best source you have doesn't even get a thank-you text.
Partner yield becomes a number
With one graph, you can calculate something most small businesses have never seen: what each partner is actually worth.
Partner yield = prospects introduced × qualification rate × close rate × average revenue
Here's an illustrative example. These are made-up partners to show the math, not real data:
The chart itself isn't the point. The point is that most small businesses can't draw it at all, because the links between people were never recorded. Once they are, networking stops being a vague feeling and becomes a measurable asset: who to thank, who to invest time in, and which paid lead source is losing to a guy at the supply-house counter.
Bad data is expensive at every size
Gartner estimates poor data quality costs organizations an average of $12.9 million a year. That's an enterprise number, and nobody reading this has that problem at that scale. But the small-business version is the same shape: duplicate records, a referral with no source, a client who's also a prospect in a different list, a goal with no tasks. Every one of those becomes a decision made without seeing the whole picture.
Goals and Tasks Belong in the Same Graph
Here's the part most CRMs miss entirely. It's not enough to know who someone is. You need to know what you're trying to accomplish with them, and whether it's on your calendar.
In the Operator OS:
- Goals are deliberate. You don't create one for every contact. After research says an opportunity is real, you set one: "Convert Dana's brokerage into an Operator OS client, $4,500, by November 1."
- Goals generate tasks. Research her workflow ✓, build a simulated cockpit, demo Thursday, send proposal, close.
- Tasks flow into your day. Those tasks appear in your weekly attention graph and daily timebox next to the HVAC follow-ups and the grocery run. Nothing is stranded inside a profile you forgot to open.
That's the chain that makes this an operating system and not a contact list: relationships generate goals, goals generate tasks, tasks consume attention, attention produces outcomes. And the outcomes get written back to the relationship. That's how Dana's partner value got calculated in the first place.

Run Your Own Numbers
Try answering these about your own business, from your current tools, in under two minutes each:
| Question | Can you answer it? |
|---|---|
| Who are your top three referral sources this year, by revenue? | |
| How many of your current clients started as referrals? | |
| Which past clients have also sent you work? | |
| For your biggest open opportunity: what's the goal, the deadline, and the next task on your calendar? | |
| Is anyone in your contact list recorded twice, as both prospect and client? |
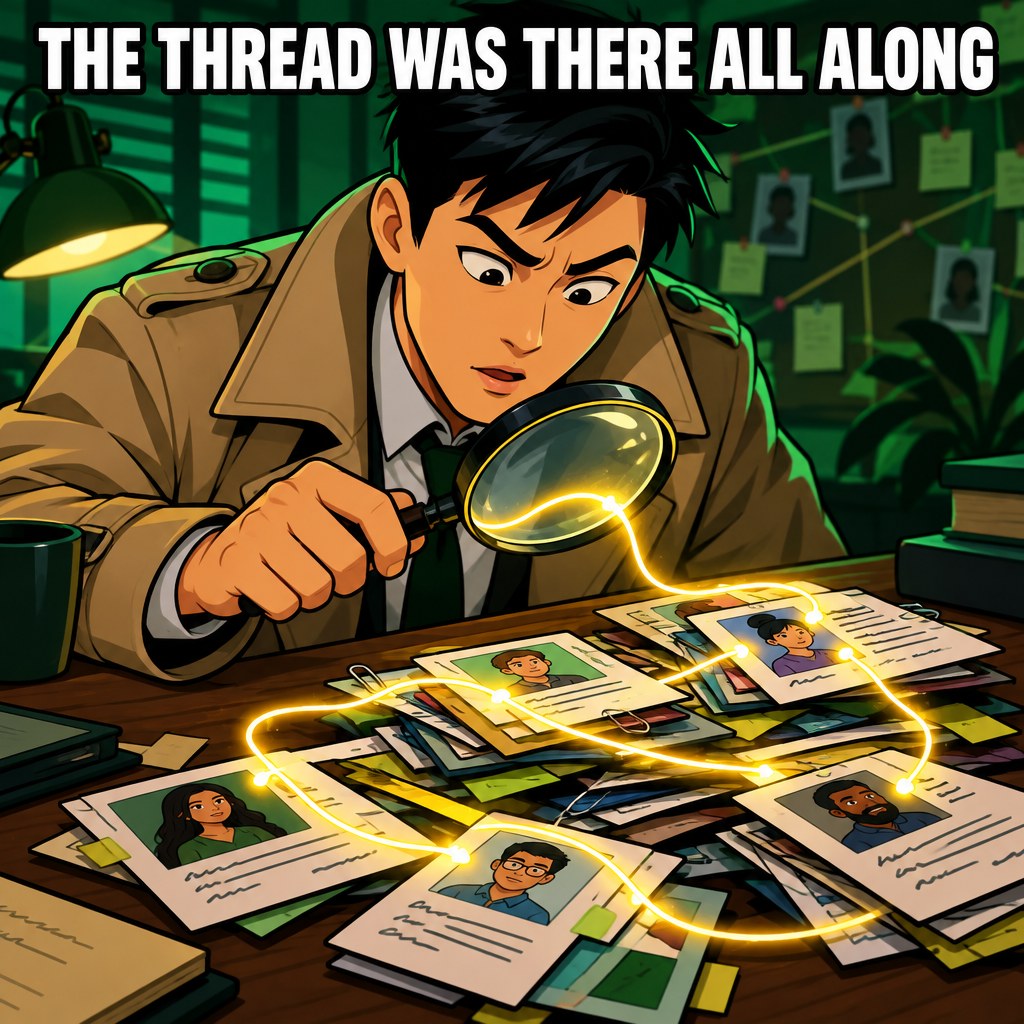
If most of those are "not without digging," your data isn't bad. It's disconnected. And disconnected data hides your best relationships.
Rough upside math, using the research as a guide: if 30% of your customers come from referrals and they're worth even 16% more than your other customers, then relationships you can't see are carrying a meaningful slice of your revenue. The first step to growing that slice is being able to see it.
What the Research Doesn't Tell Us
The referral-value research comes from a German bank, and later work in other industries, not from contractors or brokerages. The partner-yield chart is a fictional example. The data-quality cost is an enterprise estimate. We're not aware of published research comparing single-graph versus multi-tool setups in small businesses. The case for one graph rests on the referral economics plus the simple fact that disconnected records can't answer connected questions.
Moral of the Story
- Add a "referred by" field to every new contact, starting today, even if it's just a note in your phone. It's the single most valuable piece of data you're not collecting.
- List your top five relationships by total impact, including what they referred, not just what they bought. Send each one a real thank-you this week.
- Stop duplicating people across lists. When a prospect becomes a client, move them, don't copy them. One person, one record, changing roles.
- Put one dated goal on your biggest opportunity, and make sure its next task is on your actual calendar.
- Want to see your relationships as a graph instead of a list? Book a discovery call. We'll show you AutoNateAI's own prospects, clients, and partners running in one live cockpit.
Sources
Book a 20–30 minute discovery call.
We'll show you a live Operator OS cockpit and tell you straight whether it fits.
Related questions
 Published
Why Does Adding Another CRM Often Increase the Owner's Cognitive Load?
A CRM stores information. It doesn't carry it. Add one more tool that doesn't share memory and you've added pairs to reconcile, and the owner is still the integration layer.
 Published
What Should Happen Automatically After a New Prospect Enters Your Business?
Six things should happen automatically in the first 48 hours: capture, recognize, acknowledge, research, route, follow up. In most shops the owner does all six by hand, hours late.
 Published
Can a 5-Person Company Operate With the Information Discipline of a 50-Person Company?
Big companies pay whole teams to keep information straight. Small ones pay with the owner's evenings. AI finally makes the clerical half of that discipline affordable.