Diesel Just Hit $6.285. What Does That Actually Cost a Bootheel Farm?
How much does the September 2026 diesel shock change per-acre and per-bushel economics for rice, corn, soybeans, and cotton across field operations, irrigation, drying, and hauling in Southeast Missouri — and which stakeholder in the value chain actually bears the cost?
Short Answer
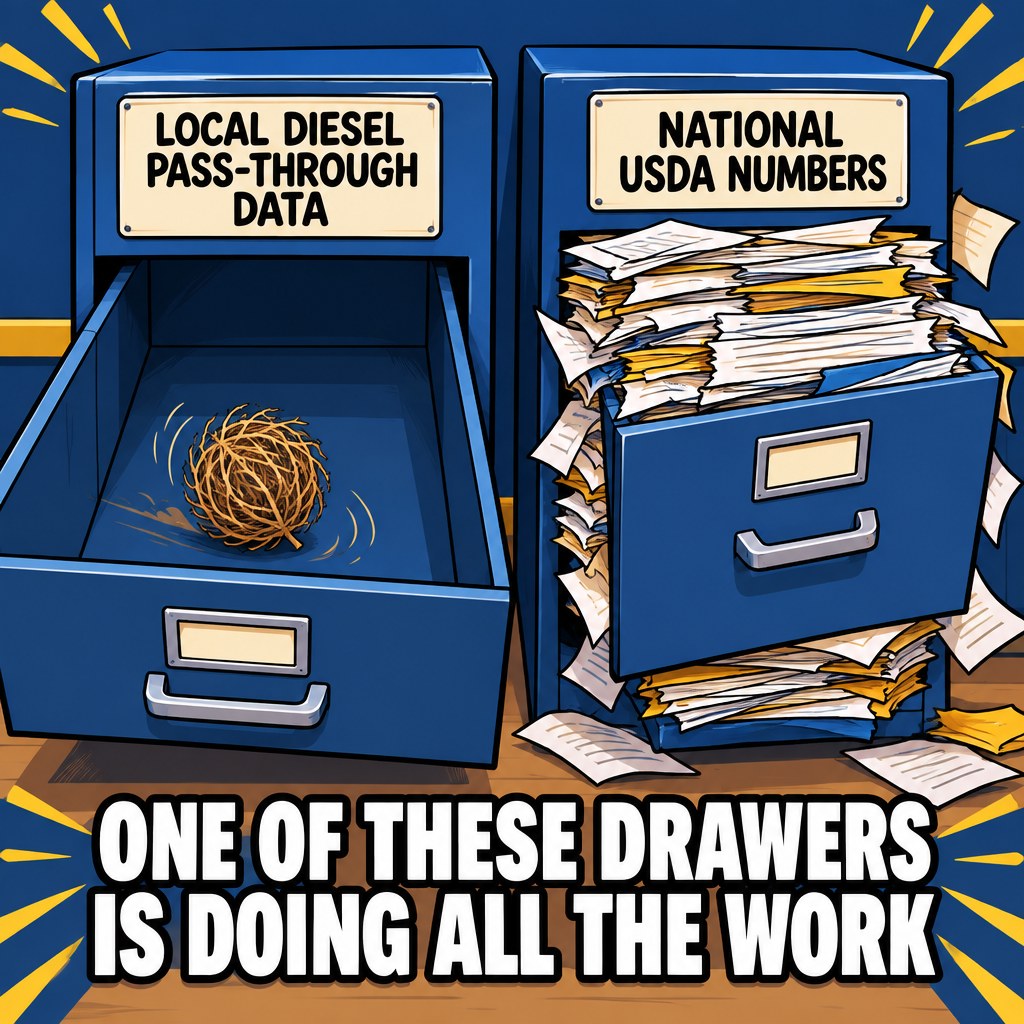
Every farmer down here already knows diesel is expensive right now — you don't need me to tell you that part. What I can tell you, and what nobody's published yet, is exactly where in the chain that extra money actually lands. Status: investigating. The shock itself is fully verified — USDA's own transportation desk named harvest, drying, and hauling as the exposed activities, not some vague "fuel inflation" story. What isn't verified yet is the dollar figure per acre, and who — grower, dryer, trucker, or buyer — actually eats it. I'm not going to hand you a made-up number to fill that gap.
Why This Land Runs on Diesel More Than Most
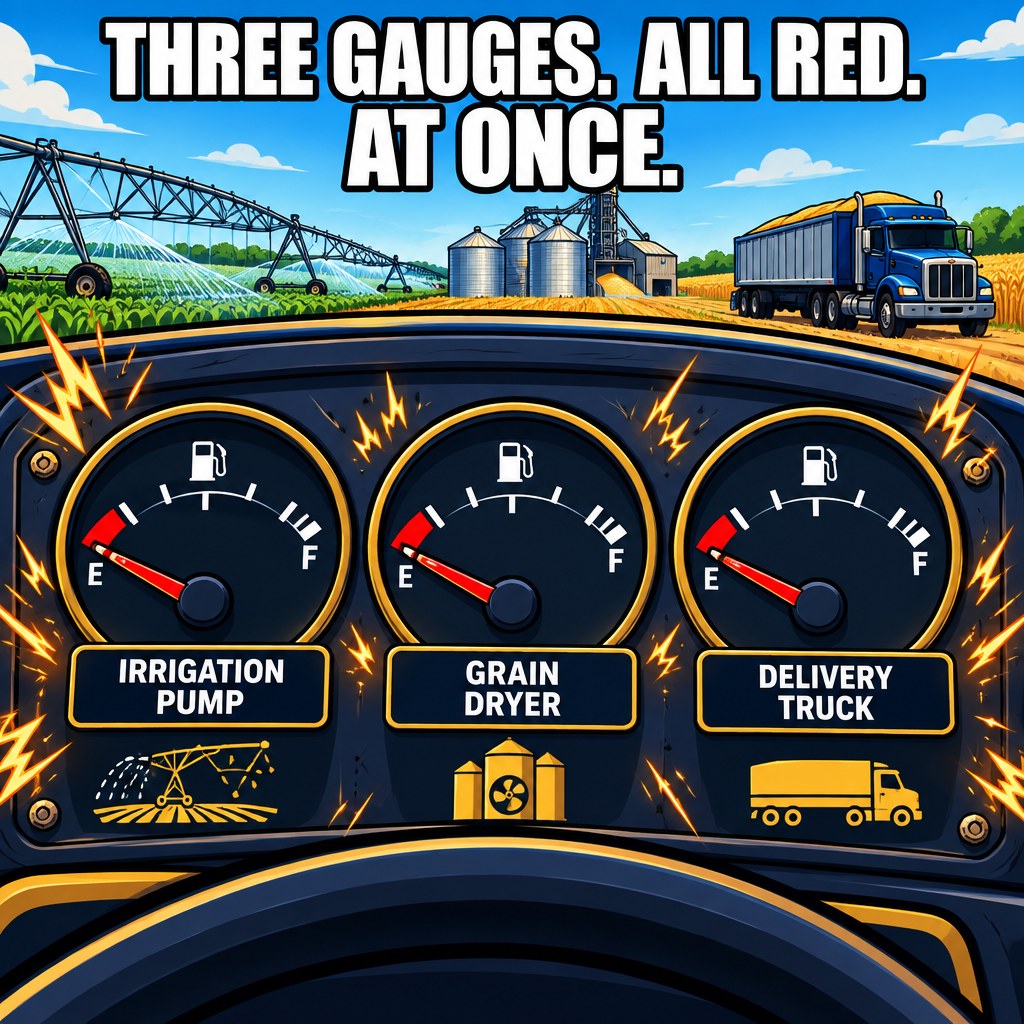
The Bootheel isn't dryland farming. This is drained swamp — a hundred-plus miles of levees and ditches the Little River Drainage District built between 1914 and 1928 to turn Mississippi River overflow basin into rice and row-crop ground. That history matters again this month for a specific reason: rice here still means flood irrigation, and flood irrigation, drying, and hauling grain out on gravity-drained delta roads are three of the most fuel-intensive things a farm operation does all year. A wheat farmer in a dryland state feels a diesel spike as an inconvenience. A Bootheel operation running pumps, dryers, and grain trucks at the same time in September feels it as a multi-front cost event.
The Number Itself
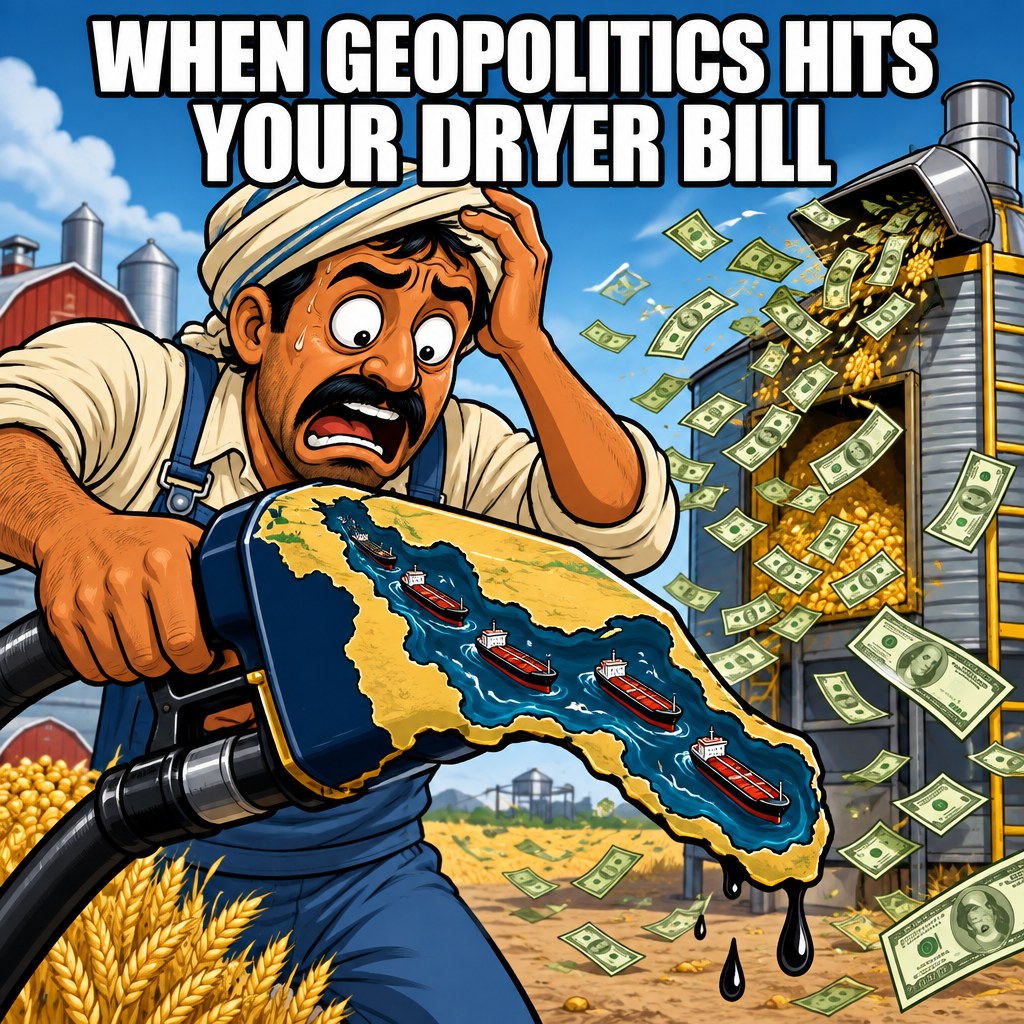
USDA's Agricultural Marketing Service doesn't publish a weekly grain transportation report to talk about pump prices in the abstract — they publish it because diesel is a direct input to three things: the truck that hauls to the elevator, the dryer that runs on fuel oil or propane priced off the same energy complex, and, here specifically, the pump that keeps a rice paddy flooded. The same report ties the spike to a real, specific cause: shipping through the Strait of Hormuz has dropped to its lowest level since the U.S.-Iran conflict began, squeezing global fuel supply. This isn't a seasonal blip — it's a geopolitical shock landing during the single most fuel-intensive six weeks of the Bootheel's year. (USDA AMS — Grain Transportation Report, Sep 17, 2026)
How This Connects
open_with Drag nodes to rearrange, tap one for the evidence behind it — pinch or scroll to zoom.
Harvest Is Running Hot at the Exact Wrong Moment
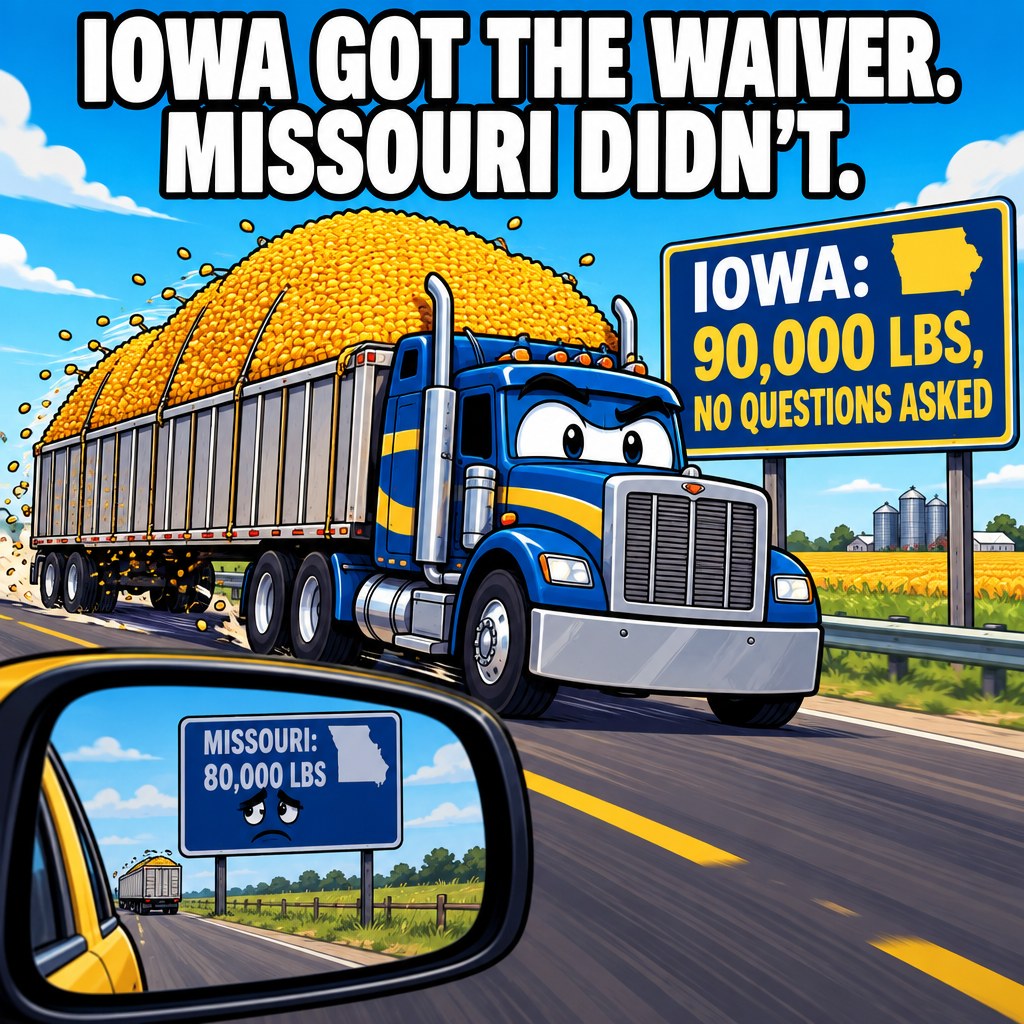
That's not a coincidence of timing — the same report shows corn and soybean harvest running 8% and 6% complete through mid-September, both ahead of the five-year average. More grain is moving, faster, at the exact moment the fuel underneath every mile of that movement got 68% more expensive year-over-year. A Corn Belt neighbor already felt this enough to act: effective through October 10, Iowa issued weight-limit exemptions letting grain trucks run up to 90,000 lb gross — 20,000 lb over the normal limit — explicitly to cut the number of truckloads needed during harvest. The Iowa Corn Growers Association's own president put a number on it: a 500-acre farm saves 13 truckloads this harvest, a 1,000-acre farm saves 26. Missouri hasn't announced an equivalent waiver as of this writing — that's worth someone in Jefferson City hearing about. (USDA AMS — Grain Transportation Report, Sep 17, 2026)
The Crop Mix Question Sitting Underneath All of This
This is a genuinely separate finding from the diesel shock, and I want to be honest about that rather than stitching two true things into one false narrative. Missouri's rice contraction is state-level, verified, and real — a 44.6% year-over-year drop. Soybeans, the flood-irrigation-free alternative, ticked up statewide. Whether that's growers reading exactly this fuel-cost math and shifting acreage toward the crop that doesn't need a flooded field, or whether it's driven by water availability, price-support policy, or something else entirely, is precisely the county-level rice-to-soybean attribution question our companion investigation is still chasing. (USDA NASS — Crop Production, Sep 11 2026)
Where This Is Happening
Methodology
This pass leaned on two USDA primary sources released within a week of each other — the Sep 17, 2026 Grain Transportation Report (diesel, rail, barge) and the Sep 11, 2026 Crop Production report (state-level rice and soybean acreage) — plus our own two prior SEMO investigations for the credit and biomanufacturing threads this connects to. What it explicitly did not do: pull Missouri University Extension or USDA enterprise-budget fuel-use-per-acre figures, collect local custom-rate or dryer-tariff data, or interview a single Bootheel grower, elevator manager, or trucker. Those are the exact inputs a real per-acre, per-bushel cost model needs, and I'd rather tell you that plainly than publish a number I can't defend.
Moral of the Story
If you're a grower: ask your lender or crop-insurance agent one specific question this month — has anyone modeled what an extra $2.50+/gallon on your actual diesel use this season does to your breakeven, by crop? If nobody has, you're the first data point.
If you're a lender: the diesel shock is a new, cleanly measurable variable your existing crop-stress model probably doesn't have a field for yet. It's a better predictor than a generic "input cost inflation" line item — it's dated, it's sourced to USDA, and it hit hardest exactly when harvest cash flow matters most.
If you're an elevator or custom trucking operator: you are the least-visible link in this chain in the public data, and also possibly the one actually absorbing the shock right now. Missouri growers would benefit from knowing whether your fuel surcharges are moving in real time or on a lag — that's a genuinely useful thing to be transparent about this season.
Related Research
This connects directly to our investigations into Farm Credit Southeast Missouri's rising credit stress and the Bootheel's rice-to-soybean acreage shift — three separate threads converging on the same 12-county territory this season.
Where This Stands
Investigating
Our Best Guess So Far
The diesel shock is real and verified at the national/workflow level, and Bootheel rice's flood-irrigation requirement makes this region more fuel-exposed than most U.S. row-crop geographies — but the actual per-acre and per-bushel dollar incidence, and which stakeholder in the value chain absorbs it, cannot be determined from public data alone. This is a hypothesis to test against local fuel-use, custom-rate, and contract-incidence data, not a conclusion.
What Got Us Asking This
- linkUSDA AMS — Grain Transportation Report, Sep 17 2026 — National average diesel hit a record $6.285/gal for the week ending Sep 14, up 31.8¢ week-over-week and 254.6¢ above the same week last year; USDA explicitly names harvest, drying, and hauling as exposed activities, and links reduced Strait of Hormuz shipping (U.S.-Iran conflict) to the fuel-price pressure.
- linkUSDA NASS — Crop Production, Sep 11 2026 — Missouri rice planted acreage fell from 213,000 (2025) to 118,000 (2026), a 44.6% decline; soybean planted acreage rose from 5.6M to 5.95M acres.
- linkUSDA AMS GTR — Iowa harvest weight exemptions — Iowa issued weight-limit exemptions up to 90,000 lb gross through Oct 10, 2026 to cut truckloads needed during harvest amid high fuel prices — a real, contemporary state-level policy response to the same shock.
How This Connects
The Physical Side
Flood-irrigated rice, drying, and hauling all run on diesel or diesel-priced energy; the Bootheel's drained-swamp geography (Little River Drainage District, 1914-1928) makes flood irrigation a routine input soybeans and dryland crops elsewhere don't share.
The Money Side
Feeds directly into the same Farm Credit Southeast Missouri credit-classification trend our companion investigation is tracking — adversely classified loans already rose from 4.7% to 7.3% across three straight 2026 quarters before this specific shock is even accounted for.
The Day-to-Day Work
Growers, custom operators, elevators, dryers, and truckers each sit on a different side of who actually pays for the extra fuel — public data cannot show contract-level incidence.
The Data/Systems Side
USDA's weekly Grain Transportation Report and monthly Crop Production report supply the national/state-level signal on a fast cadence; local fuel-use, custom-rate, and dryer-tariff data doesn't exist publicly and would require direct outreach.
Who We'd Like to Talk To
- Bootheel rice, corn, soybean, and cotton producers
- Farm Credit Southeast Missouri loan officers
- Regional grain elevators, dryers, and custom trucking operators
- Missouri Department of Transportation freight policy staff
- University of Missouri Extension — Fisher Delta Research Center
What We Still Need
- MU/USDA enterprise-budget diesel-use-per-acre figures by crop for Southeast Missouri
- Local custom trucking, drying, and irrigation-pumping rates and how fast they're moving with the fuel price
- Representative Bootheel haul distances to elevators and river terminals
- Contract-level pass-through terms between growers, elevators, and buyers
- A direct conversation with a Bootheel grower, custom operator, or elevator manager — zero interviews conducted so far
What We'll Build From This
- Bootheel Harvest Cost Propagation Engine — a transparent, low/base/high sensitivity model translating the national diesel price into per-acre and per-bushel cost ranges by crop, with an evidence-labeled stakeholder-incidence waterfall
What We Found
The diesel shock and its exposed workflows (harvest, drying, hauling) are fully verified at the national level via USDA's own transportation desk, and Missouri's rice acreage has genuinely contracted 44.6% while soybean acreage held roughly flat to slightly up — two real, sourced, state-level facts. What remains unverified is the actual dollar incidence per acre and per bushel locally, and which stakeholder in the SEMO value chain bears it; that requires local budget data and interviews this pass did not have access to, which is why status stays "investigating."