Farm Credit SEMO's Crop Loan Stress Is Rising. What Is Driving It?
Can public crop, input-cost, freight, and lender disclosures explain the rise in Farm Credit Southeast Missouri's adversely classified and nonperforming loans without using confidential borrower data?
Short Answer
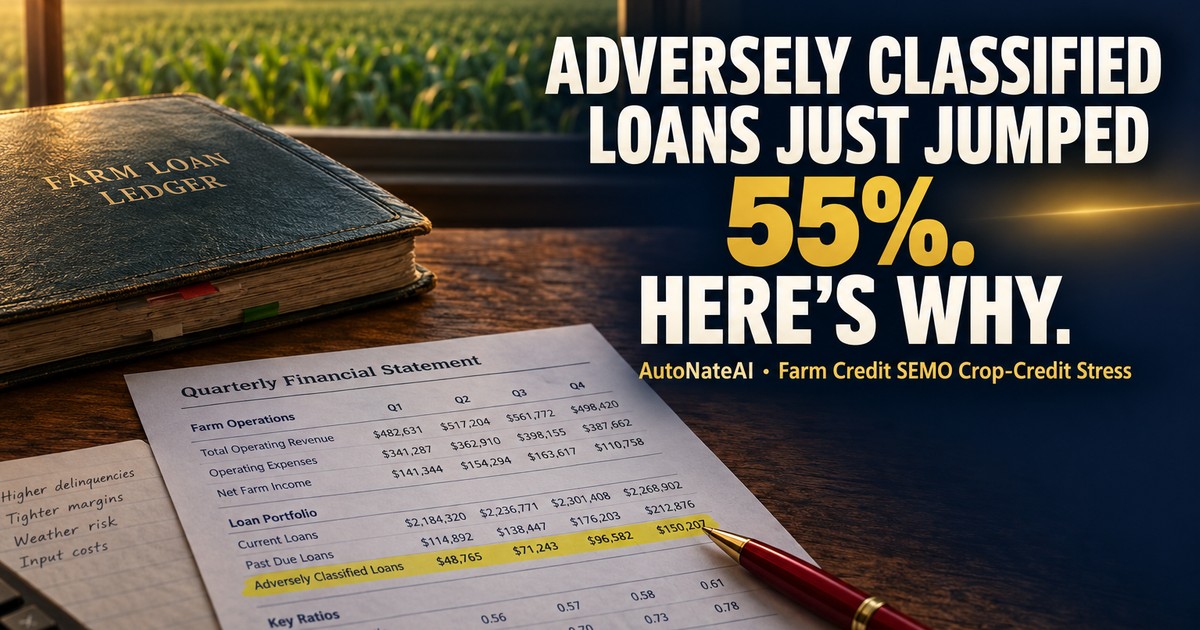
Farm Credit Southeast Missouri's own numbers moved more this year than most quarterly reports ever admit to: adversely classified loans went from 4.7% of the portfolio at year-end 2025 to 6.3% in March to 7.3% by June — a real, quarter-by-quarter escalation, not a single bad print. The association's own management said why, in plain language, in the filings themselves: "continued adverse economic conditions within the crop sector," and — more specifically, in the March filing — the Iran conflict's energy and fertilizer volatility pushing some producers to reconsider corn and cotton acres in favor of soybeans. Pull the five-year picture and this year isn't even the start of the story: net income had already been sliding every year since 2021 before a single loan got reclassified in 2026. What public data still can't do is tell you which commodity, which county, or which specific cost is doing the most damage — that's not evasion, that's just what's actually disclosed right now. Status: investigating.
Why This Lender's Numbers Mean Something Different Than a Bank's
Before you can read "adversely classified loans up 55% in six months" correctly, it helps to know what kind of institution is reporting it. Farm Credit Southeast Missouri isn't a regional bank branch — it's a cooperative, part of a system Congress built on purpose. On July 17, 1916, President Wilson signed the Federal Farm Loan Act specifically because rural lenders kept avoiding agricultural loans as too risky, leaving farmers without credit at reasonable terms. The fix Congress landed on was a network of borrower-owned lending cooperatives: part of every farmer's loan bought stock in the association, making that farmer a part-owner of the institution lending to them. (Farm Credit Administration — History of FCA) That structure is still exactly how Farm Credit SEMO runs today — which is why its board is stocked with actual producers, why it's paid out over $138.3 million in cash patronage to its member-owners over the past 32 years, why it just authorized a record $9.1 million patronage refund for 2025 even as its own earnings weakened, and why "credit quality declined" here isn't a story about a distant lender tightening the screws. It's a story about the lending cooperative's own farmer-owners collectively showing more stress than they were a year ago — while the cooperative keeps distributing more back to them anyway, not less.
How This Connects
open_with Drag nodes to rearrange, tap one for the evidence behind it — pinch or scroll to zoom.
Drag the slider and watch the last box move — but read the fine print on it honestly. That number is a straight line drawn between two real, disclosed points (4.7% in December, 7.3% in June), not a model anyone fit to data. What the diagram *does* show accurately is the shape of the argument: three real, disclosed forces (input costs, a large direct-payment injection, and a decelerating collateral cushion) feed into a producer's cash margin, which — this is the honest part — is only an estimated, not verified, link to actual repayment capacity, which is only a hypothesis, not yet provable from public data, as the specific thing driving a specific lender's classification decisions. Two of five edges are solid for a reason; the third is dashed for the same reason.
The Policy Signal That's Supposed to Be Helping — and the War That Wasn't in Anyone's Forecast
USDA's Economic Research Service forecasts $47.4 billion in direct government farm payments for 2026 — a 69.8% jump from 2025's $27.9 billion, one of the largest year-over-year increases in the forecast's history. (USDA ERS — Farm Sector Income Forecast, updated Sep 3 2026) That's real, and it shows up on the ground: the Federal Reserve's own Eighth District survey — the correct district for Southeast Missouri, more on that below — reports a Mississippi farm-equipment supplier saying sentiment has improved specifically because of "higher crop prices and additional government support." So the policy lever is working, in the sense that real money is reaching real producers.
It's just landing in the same season as something nobody's 2026 farm budget had a line item for. Farm Credit SEMO's own March 2026 filing says it plainly: "The war with Iran has created upward volatility in energy and fertilizer markets that will likely offset any anticipated higher gross income and have a direct impact on 2026 crop margins. Many producers are reassessing their plans for the year and may be looking to shift some of their intended higher input cost crops, such as corn and cotton, over to soybean acres instead." (Farm Credit Southeast Missouri — Q1 2026 Stockholder Report) That's a lender naming a geopolitical shock, in writing, as a reason its own borrowers are reconsidering what to plant — a genuinely different, and more current, mechanism than the rice-versus-soybean policy tension the Bootheel pivot investigation on this site already tracks. Read together: one federal lever is pushing liquidity in, a foreign war is pushing costs up in a way that specifically favors soybeans over corn and cotton, and Farm Credit SEMO's own portfolio is the first place all of that nets out into a number.
The Numbers So Far
Read together, these three charts are the actual case: the credit deterioration is a real, multi-quarter, disclosed trend sitting on top of a five-year earnings decline that already had this cooperative's return on equity cut in less than half before 2026 even started. The national cost/liquidity numbers plausibly explain the *direction* of it. None of that proves which crop or which county is driving it — that's the gap the next phase of this investigation still has to close.
Where This Is Happening
Every one of these points sits inside the 12-county SEMO territory this lender serves — a region MoDOT's own freight plan describes as running on I-55, I-57, and I-155, BNSF and Union Pacific rail, and river terminals at SEMO Port and the New Madrid, Mississippi, and Pemiscot County ports. (MoDOT — Southeast District Freight Plan) Harvest is a physical-flow event before it's a financial one — how fast a crop actually gets off the field and onto one of these routes affects when a producer actually gets paid, which affects repayment timing in ways a quarterly credit-quality number can't distinguish from a genuine income problem.
What's Actually Happening on the Ground Right Now
The dossier that started this investigation cited a Kansas City Fed survey as a regional comparison point — worth correcting directly, because it's not the right district. Southeast Missouri sits in the Federal Reserve Bank of St. Louis's Eighth District, not Kansas City's Tenth (which covers the western third of the state, around Kansas City itself, plus Kansas, Nebraska, Oklahoma, and Wyoming). Once you pull the actual Eighth District source — the Federal Reserve's Beige Book released September 2, 2026 — the finding gets sharper, not softer: "Agriculture conditions remain stressed but have slightly improved since our previous report." A Mississippi farm-equipment supplier said new-machinery sales are "still weak, but farmer sentiment has improved, driven by higher crop prices and additional government support" — the same liquidity effect the ERS numbers predict. And specifically on rice: an Arkansas rice processor "observed decreased rice demand due to increased imports," while a soy processor in the same district reported "continuous crushing and refining operations fueled by strong demand" — a live, on-the-record echo of the same rice-versus-soybean demand asymmetry the Bootheel rice-to-soybean pivot investigation on this site is tracking from the policy side. The same report's Prices section adds one more forward-looking flag: agriculture contacts "anticipate record-high input costs for 2027," meaning whatever's driving this year's classified-loan increase isn't obviously a one-year event. (Federal Reserve Beige Book, released Sep 2 2026 — St. Louis / Eighth District)
Methodology
This pass pulled directly from Farm Credit Southeast Missouri's own Q1 2026, Q2 2026, and 2025 Annual Report filings (fetched and read in full, not summarized secondhand), USDA ERS's September 2026 Farm Sector Income Forecast, the Farm Credit Administration's September 10, 2026 systemwide quarterly conditions report, the Federal Reserve's September 2, 2026 Beige Book (St. Louis/Eighth District specifically — the Kansas City/Tenth District source in the originating dossier was geographically mismatched and replaced here), MoDOT's Southeast District Freight Plan, and the Farm Credit Administration's own history page. It does not yet include: Farm Credit SEMO's loan exposure broken out by commodity (rice vs. soybeans vs. corn vs. cotton isn't publicly disclosed anywhere found), county-level 2025-26 crop acreage or yield estimates for the 12-county territory, any elevator or dryer throughput/utilization data, crop-insurance indemnity data by geography, or a single direct conversation with a SEMO grower, loan officer, or elevator manager. Every one of those is a real, named next step, not an afterthought. The slider in the "How This Connects" diagram is a linear extrapolation anchored to two real disclosed numbers, not a fitted statistical model — treat any estimate past its "disclosed value" marker as a scenario, not a forecast.
Moral of the Story
The headline number here — adversely classified loans up more than half in six months, across three consecutive disclosed quarters — is real, not in dispute, and sitting on top of a five-year earnings decline most people watching this sector haven't connected to it yet. What's still a hypothesis is the *why*, at any resolution finer than "the crop sector broadly." A few concrete things that fall out of that:
- If you're a Farm Credit SEMO borrower, the association's own capital ratios (total capital ratio 19.2% against an 8% regulatory minimum, members' equity actually *up* as a share of assets over the past five years even as earnings fell) mean this isn't a lender in trouble — it's a cooperative watching its own farmer-owners absorb a margin squeeze. That changes the renewal conversation from "is my lender stable" to "how do I show I'm not the borrower driving the trend."
- If you're a lender or loan officer anywhere in the region, the Iran-conflict input-cost shock is worth asking about directly and by name — Farm Credit SEMO's own March filing already flags it as a reason growers are reconsidering corn and cotton for soybeans. That's a more current, more specific question than a generic "how's the crop budget looking."
- If you grow rice specifically, the Eighth District's own on-the-record finding — decreased rice demand from increased imports, reported by an actual Arkansas rice processor — is a second, independent signal pointing the same direction as the PLC-vs-RFS tension the Bootheel pivot investigation already surfaced. Two unrelated sources landing on the same conclusion is worth more than either alone.
- If you're in economic development or policy, the $47.4 billion direct-payment figure is genuinely large, but it's arriving into a cost environment large enough — and now with a geopolitical shock layered on top of it — to eat a meaningful share of it before it ever reaches a lender's risk classification. A program that looks generous in isolation may still net out as merely stabilizing.
None of this is a commodity-level verdict — that's exactly what the data doesn't support yet. Move the slider above, read the dashed edge, and you're looking at exactly where this investigation stops being able to tell you more.
Related Research
This investigation shares a region, a lender, and half its policy tension with Congress Just Made Rice More Profitable. So Why Are Bootheel Farmers Planting Less of It? — the structured fields below (who we'd like to talk to, what we still need, our sources) carry the parts of this investigation that update independently of the write-up above.
Where This Stands
Investigating
Our Best Guess So Far
A public-data propagation model combining crop mix, input costs, freight/basis, government support, and a newly-identified geopolitical cost shock (the Iran conflict's energy/fertilizer volatility) will explain a meaningful share of the direction of local agricultural credit stress, while borrower-level and commodity-level causation remain unobservable from public data alone. This is a hypothesis to test against county-level and interview data, not a conclusion.
What Got Us Asking This
- linkFarm Credit Southeast Missouri — Q2 2026 Stockholder Report — Adversely classified loans rose from 4.7% (12/31/25) to 7.3% (6/30/26) of the portfolio; nonperforming loans rose from 1.3% to 2.3%. Management explicitly attributes the rise to "continued adverse economic conditions within the crop sector."
- linkFarm Credit Southeast Missouri — Q1 2026 Stockholder Report — Names a specific new driver: "The war with Iran has created upward volatility in energy and fertilizer markets... producers... may be looking to shift some of their intended higher input cost crops, such as corn and cotton, over to soybean acres instead."
- linkUSDA ERS — Farm Sector Income Forecast, Sep 3 2026 — 2026 real net farm income forecast down 5.5%; fuel/oil expenses +28.8%, fertilizer/lime/soil-conditioner expenses +15.3%; direct government payments forecast $47.4B, +69.8% YoY.
How This Connects
The Physical Side
Harvest moves fast across SEMO's 12 counties on I-55/57/155, BNSF/UP rail, and Mississippi River terminals at SEMO Port, New Madrid, Mississippi, and Pemiscot counties — freight/basis friction shows up as cash-flow timing before it shows up in a credit file.
The Money Side
Farm Credit SEMO's own portfolio: $946.9M in loans, adversely classified loans up from 4.7% to 7.3% across three straight quarters, even as capital ratios stayed roughly 2-3x regulatory minimums and a five-year earnings decline (ROE 11.2%→5.1%, 2021→2025) predates all of it.
The Day-to-Day Work
A loan officer's renewal workflow now weighs input-cost inflation, a newly-disclosed Iran-conflict cost shock pushing corn/cotton acres toward soybeans, a $47.4B national liquidity injection, and decelerating farmland-value appreciation against the same crop-mix questions the Bootheel rice-to-soybean pivot investigation is tracking.
The Data/Systems Side
No public dataset currently joins county-level crop mix, input costs, freight/basis, and lender credit-quality metrics into one place — that join is exactly what the graph this site is building is for.
Who We'd Like to Talk To
- Farm Credit Southeast Missouri credit/portfolio leadership
- Row-crop producers in its 12-county SEMO territory
- USDA FSA/NRCS/FCA staff
- Grain elevator and freight operators
- Crop-insurance agents and agricultural-finance advisers
- University of Missouri Extension — Fisher Delta Research Center
What We Still Need
- Farm Credit SEMO's loan exposure broken out by commodity — not publicly disclosed
- County-level 2025-26 crop acreage/yield estimates for the 12-county territory
- Elevator/dryer throughput or utilization data
- Crop-insurance indemnity data by geography
- A direct conversation with a SEMO grower, loan officer, or elevator manager — zero interviews conducted so far
What We'll Build From This
- Public-data SEMO Crop-Credit Stress Dashboard (quarterly lender metrics × county crop mix × input-cost indices)
- 12-county crop-pivot GIS layer feeding the same model the Bootheel rice/soybean investigation needs
What We Found
Farm Credit Southeast Missouri's own filings show a real, multi-quarter credit-quality deterioration (adversely classified loans 4.7% → 6.3% → 7.3% across three consecutive disclosed quarters in 2026) sitting on top of a five-year earnings decline (return on equity 11.2% in 2021 down to 5.1% in 2025) that predates this year's classification spike entirely. Public national data (rising fuel/fertilizer costs, a large direct-payment increase, decelerating farmland-value growth) plausibly explains the direction of the stress, and Farm Credit SEMO's own March 2026 filing names a specific, previously-unreported driver: Iran-conflict-driven energy/fertilizer volatility pushing some producers to shift corn and cotton acres toward soybeans. None of this yet establishes which commodity, county, or cost is doing the most damage — that requires data and interviews this investigation doesn't have yet, which is why status stays "investigating."
Sources
- linkFarm Credit Southeast Missouri — Q2 2026 Stockholder Report
- linkFarm Credit Southeast Missouri — Q1 2026 Stockholder Report
- linkFarm Credit Southeast Missouri — 2025 Annual Report
- linkFarm Credit Southeast Missouri — 2025 patronage refund announcement
- linkUSDA ERS — Farm Sector Income Forecast, updated Sep 3 2026
- linkFarm Credit Administration — quarterly conditions report, Sep 10 2026
- linkFarm Credit Administration — History of FCA
- linkFederal Reserve Beige Book, released Sep 2 2026 (St. Louis / Eighth District)
- linkMoDOT — Southeast District Freight Plan
- linkUSDA NASS — Missouri 2026 State Agriculture Overview