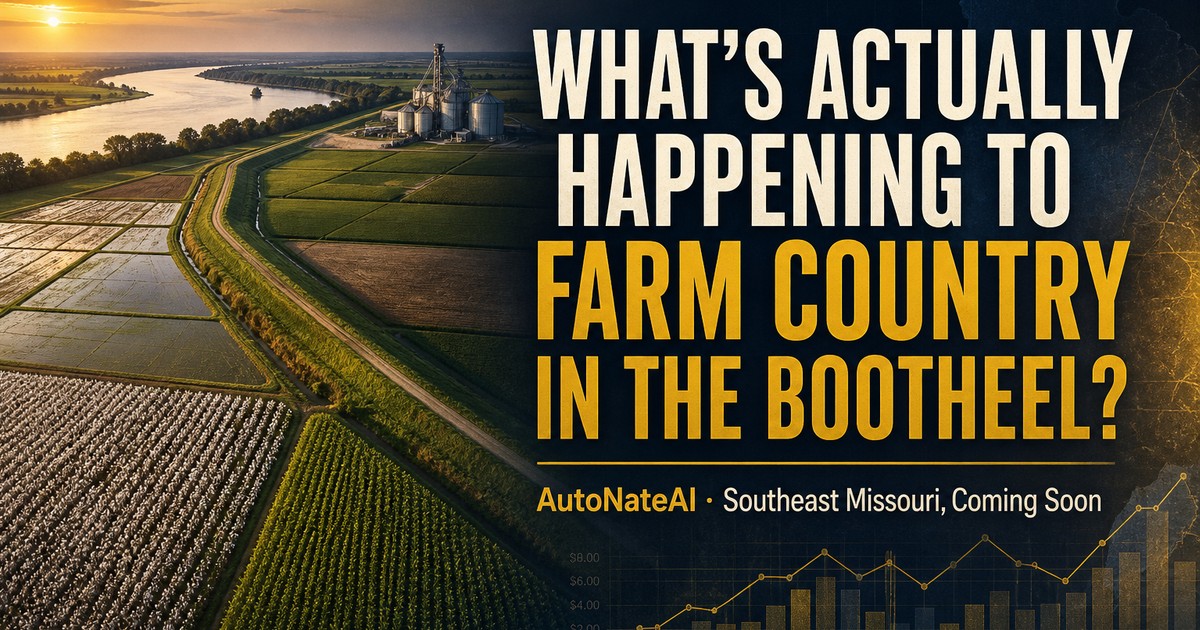
Congress Just Made Rice More Profitable. So Why Are Bootheel Farmers Planting Less of It?
As Missouri rice acreage comes under water- and weather-driven pressure while national soybean acreage expands, how would a continued Bootheel-level shift from rice toward soybeans change grower cash flow, Farm Credit lending exposure, and regional elevator/freight demand?
Short Answer
Two months ago I could've handed you a clean headline — "water's drying up, rice is dying, soybeans are winning" — and it would've made a decent LinkedIn post. It's not true, or at least it's not the whole truth, and the whole truth is a better story. What I actually found chasing this question down is three different arms of the federal government pulling the same farmer in three different directions in the same calendar year, sitting on top of dirt that is, itself, artificial, over a water table that has never once cared about anyone's policy position. Status: still investigating, not because I came up empty, but because what I found deserves more than a yes-or-no.
Ground I'm Standing On, Literally
Before there was a "Bootheel rice industry" to have an opinion about, there was a swamp. Nearly 2 million acres of it — the overflow basin for the Mississippi and Ohio rivers and every Ozark stream that ever ran out of hillside room. In 1907, a group of timber men who'd already logged the place out incorporated the Little River Drainage District and set out to turn what was left into farmland. Construction ran from 1914 to 1928. What they left behind — over 900 miles of ditches, 300 miles of levees, draining 1.2 million acres across Bollinger, Cape Girardeau, Dunklin, New Madrid, Pemiscot, Scott, and Stoddard counties — is still, functionally, the plumbing this entire regional economy sits on top of. Every acre of rice or soybeans anyone's arguing about today is farmable at all because a hundred-plus-year-old engineering project said so. That's not trivia. That's the reason this is delta-flat, ditch-veined, gravity-drained land instead of a bayou — and it's worth remembering before anyone treats "the way the Bootheel farms" as a law of nature instead of a very deliberate, very old decision. (Little River Drainage District — official history)
How This Connects
open_with Drag nodes to rearrange, tap one for the evidence behind it — pinch or scroll to zoom.
Rice and soybeans share a farm, and often a lender, and not much else once they leave the field. Rice needs the flood-irrigation infrastructure soybeans never touch — wells, levees, a dryer built for a different moisture curve. A real pivot doesn't just change what's planted; it changes what's sitting idle, what a loan officer is underwriting, and what an elevator needs to be ready to handle at harvest.
Three Signals, One Farmer
Here's the part that made me stop writing the easy version of this piece. I went looking for "why would someone leave rice for soybeans" and found something more interesting: three separate federal policy levers, moving in the same season, pointing three different directions.
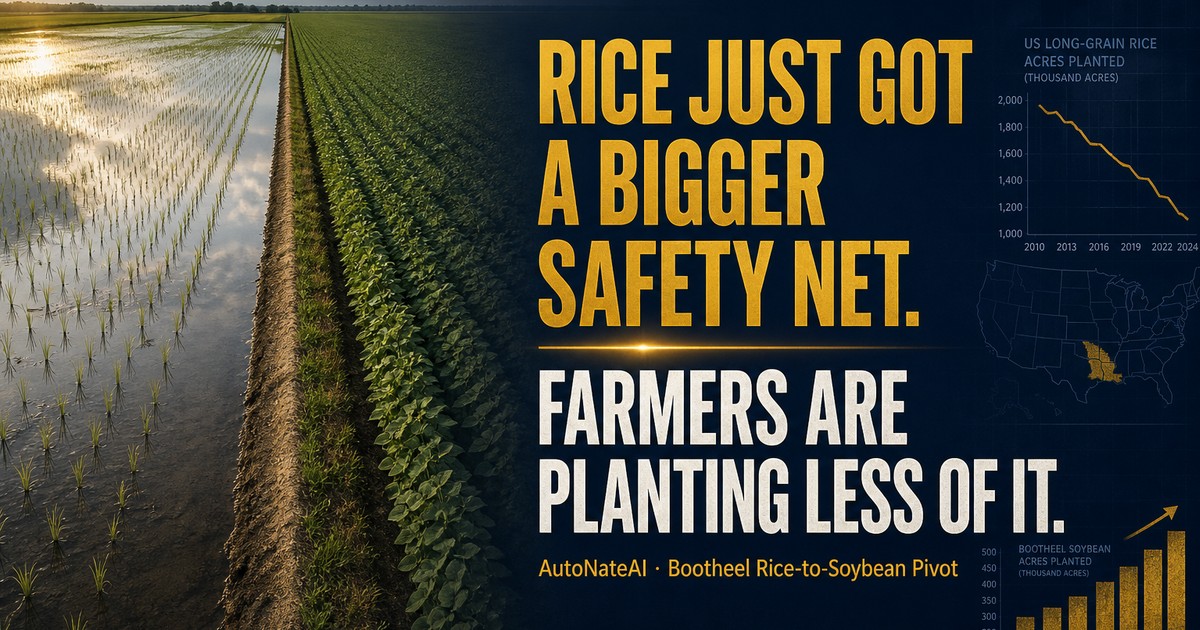
Signal one — Congress just told rice growers to stay. The One Big Beautiful Bill Act (H.R. 1, enacted July 2025) raised the Price Loss Coverage reference price for rice 20.7%, from $14.00 to $16.90 per hundredweight — the largest increase given to any covered commodity in that bill. That's not a subtle nudge. That's Congress rebuilding rice's safety net wider than it's been in years, right as the water underneath it gets more expensive to pull. (USA Rice Federation: "Rice Wins with Enactment of the One Big Beautiful Bill Act")
Signal two — EPA just told soybeans to grow up. On March 27, 2026, EPA finalized 2026-2027 Renewable Fuel Standard volumes requiring a 60% jump in biodiesel and renewable diesel production versus 2025, with soybean oil use for biofuel projected up roughly 17% — worth an estimated $31 billion to corn and soybean oil producers in 2026 alone, $2 billion more than 2025. That's real, durable, domestic demand pull that has nothing to do with anyone overseas buying a bushel. (Holland & Knight: EPA Boosts Biofuel Mandates in Final RFS Rule for 2026-2027)
Signal three — the export market soybeans actually need is still hurt. China halted soybean purchases in May 2025 in retaliation for tariffs, pushing its total duty on U.S. soybeans to 34%. The negotiated fix — 12 million metric tons by the end of 2025, at least 25 million metric tons a year through 2028 — sounds like relief until you check it against history: the five-year average was closer to 29 million metric tons, so even the "deal" locks in a market roughly 14% below normal, with a 13% tariff still standing. (farmdoc daily: U.S.-China Soybean Deal, comparing past export levels)
Put plainly: the same Congress that just made rice's price floor more attractive is a different branch of the same government making soybean demand more attractive for entirely different reasons — and a third arm, trade policy, is quietly capping how far that soybean demand story can actually run. Nobody wrote a memo reconciling these three. The farmer in the middle has to.
The Numbers So Far
None of these three charts contradicts the others — that's exactly the point. Rice's safety net got stronger, soybean's demand story got stronger, and they're both true in the same season for different reasons that have nothing to do with each other.
Where This Is Happening
The aquifer everyone in the Bootheel is drawing from doesn't start at the Missouri state line. It's one connected system stretching down through Arkansas, and the water use started there — pumping for rice and soybean irrigation in the alluvial aquifer began in the early 1900s Grand Prairie area and grew from there. By 2005, aquifer water use across the system had climbed 655% since 1965, with parts of it now declining roughly a foot a year. That's not a Bootheel problem or an Arkansas problem. It's one water table with several states' worth of straws in it. (USGS/SIU: Aquifer Depletion in the Lower Mississippi River Basin)
It's Already Showing Up This Year
This is the part I didn't expect to find so directly. Missouri's 2026 rice acreage came in below average — and when Brownfield Ag News asked USA Rice's Mollie Buckler why, she didn't point to weather. She pointed to money: "We have some farmers to the west in our region and deep south in the Bootheel starting to cut rice... We're definitely dealing with some market issues that contributed to that low acreage number that we saw this year." That's a real, current, on-the-record signal that some version of this pivot is already underway — not a hypothesis about what might happen, a trade association's own read on what's happening right now. It just doesn't come with county-level numbers attached yet, which is exactly the gap this investigation still needs to close. (Brownfield Ag News: Missouri Celebrates Rice Month as Harvest Gets Underway)
Methodology
This round pulled from USDA NASS (Acreage, Rice Outlook), the Farm Service Agency and Congressional Research Service (PLC/ARC reference prices), EPA's final Renewable Fuel Standard rule and legal-industry summaries of it, farmdoc daily's trade-data analysis of the U.S.-China soybean agreement, USA Rice Federation's own statement on H.R. 1, Brownfield Ag News' on-the-ground reporting, USGS/academic groundwater research on the Mississippi River Valley Alluvial Aquifer, and the Little River Drainage District's own historical record. It still does not include county-level USDA QuickStats data for the 12 Farm Credit SEMO counties specifically, Farm Credit Southeast Missouri's own current commodity-concentration figures, a Missouri-specific accounting of EQIP/on-farm-reservoir cost-share uptake (the strongest public data I found on that program is Arkansas-specific, via the Arkansas Groundwater Initiative), or a single direct conversation with a Bootheel grower, loan officer, or elevator manager. Those four gaps are the actual next phase of this investigation, not an afterthought.
Moral of the Story
If you take one thing from this, take this: the crop-mix decision in front of Bootheel farmers right now isn't a weather story or a water story alone — it's a bet on which federal policy lever holds up longer, and almost nobody is framing it that way. A few concrete moves that fall out of that:
- If you grow rice, the new $16.90/cwt reference price is real money worth re-running your numbers against before you assume a pivot is your only move — but it does nothing for your water bill. Pair it with a real look at cost-share water infrastructure (the Arkansas Groundwater Initiative's on-farm reservoir/tailwater-recovery model is the closest documented template; ask your local NRCS office whether an equivalent exists on the Missouri side before assuming it doesn't) before you commit capital in either direction.
- If you grow soybeans, or you're leaning that way, don't treat the biofuel-demand story as a permanent floor under the export story's problems. The China deal locks in volume that's still roughly 14% below the five-year average, with a 13% tariff still standing — model what your plan looks like if that number doesn't hold through 2028, not just if it does.
- If you're a lender, the more useful conversation with a borrower this cycle isn't "what did you plant" — it's "which of these three signals are you actually betting on, and have you sized the collateral and the loan for what happens if that bet is wrong." That's a materially different renewal conversation than the one a generic crop budget gets you to.
- If you're an elevator or infrastructure operator, the swing to watch isn't rice-versus-soybean acreage in isolation — it's whether a real pivot shows up as reduced dryer utilization before it shows up in any published county number, because Buckler's on-the-record read says growers are already moving ahead of the data.
None of this is instructions. It's a map of exactly which questions are worth asking before the next planting decision, instead of after.
Related Research
The structured fields below this narrative — what got us asking this, who we'd like to talk to, what we still need, and our sources — carry the parts of this investigation that update independently of the write-up above.
Where This Stands
Investigating
Our Best Guess So Far
Rice requires flood-irrigation infrastructure (levees, wells, dryers) that soybeans don't — a sustained pivot would idle rice-specific capital assets, change loan collateral/valuation profiles for affected acreage, and shift elevator/dryer throughput toward soybean handling. That basic mechanics story is complicated by three federal policy levers moving in different directions at once (a bigger rice price floor, stronger soybean biofuel demand, a still-weak soybean export market) — the actual pivot decision is as much a bet on which lever holds as it is a response to the water table. This is a hypothesis to test against county-level data, not a conclusion.
What Got Us Asking This
- linkUSDA NASS — national Acreage report, Jun 30 2026 — Soybean planted acreage up 5% from 2025 (85.4M acres); corn planted acreage down 3% from 2025 — national row-crop acreage is actively reallocating.
- linkUSDA NASS — Rice Outlook, Jul 2025 — Missouri's 2025 rice planting estimate was lowered ~20,000 acres from March intentions after May weather prevented planting; national rice harvested area was lowered 121,000 acres to 2.647M acres.
- linkUSA Rice Federation — H.R. 1 coverage, Jul 2025 — The One Big Beautiful Bill Act raised the rice PLC reference price 20.7%, from $14.00 to $16.90/cwt — the largest increase of any covered commodity.
- linkEPA — final Renewable Fuel Standard rule, Mar 27 2026 — 2026-2027 RFS volumes require a 60% jump in biodiesel/renewable diesel production vs. 2025, with soybean oil use for biofuel up ~17% — a $31B value to corn/soybean-oil producers in 2026.
- linkfarmdoc daily — U.S.-China soybean deal, Nov 2025 — China's negotiated purchase commitment (25M metric tons/yr through 2028) still runs ~14% below the 2020-2024 five-year average, with a 13% tariff still standing.
- linkBrownfield Ag News — Missouri Rice Month, 2026 — USA Rice's Mollie Buckler, on the record: Missouri growers 'starting to cut rice' this year over 'market issues,' not weather.
How This Connects
The Physical Side
Rice-specific infrastructure (levees, wells, dryers) sits idle or gets repurposed as acreage shifts; elevator/dryer throughput mix changes. All of it sits on land the Little River Drainage District engineered out of swamp between 1914-1928, over an alluvial aquifer shared with Arkansas that's been declining since large-scale pumping began near Stuttgart, AR in the early 1900s.
The Money Side
Rice ground and soybean ground carry different collateral valuation and different operating-loan sizing — a crop-mix shift changes a lender's commodity concentration. The 2025 farm bill (H.R. 1) just raised rice's PLC reference price 20.7%, which changes that collateral math again.
The Day-to-Day Work
A loan officer's operating-loan renewal workflow changes inputs: a different crop budget, different insurance product, different collateral review — and now a real question of which federal signal (rice price floor vs. soybean biofuel demand vs. capped soybean export demand) the borrower is actually betting on.
The Data/Systems Side
A lender's CRM/origination intake and portfolio dashboards would need a commodity-mix-change flag to surface this as a portfolio trend, not just one loan file.
Who We'd Like to Talk To
- Farm Credit Southeast Missouri loan officers
- Bootheel rice producers considering a crop-mix change
- Regional grain elevators with rice-drying capacity
- University of Missouri Extension — Fisher Delta Research Center agronomists
- USA Rice Federation regional staff
- NRCS Missouri/Arkansas conservation planners (EQIP, on-farm reservoir cost-share)
What We Still Need
- County-level USDA NASS QuickStats pull for the 12 Farm Credit SEMO counties: rice vs. soybean planted acres, 2019–2026
- Farm Credit Southeast Missouri's own commodity concentration by year, if published publicly
- Regional elevator/dryer capacity utilization — public data doesn't cover this; needs interviews
- Missouri-specific EQIP/on-farm-reservoir cost-share uptake — the only public program detail found so far is Arkansas' Groundwater Initiative; unclear if an equivalent exists on the Missouri side
- A direct conversation with a Bootheel grower, loan officer, or elevator manager — everything so far is public data and trade-press reporting, zero interviews
What We'll Build From This
- County-level rice vs. soybean acreage dashboard (Power BI) for the 12 SEMO counties
- SQL model comparing hypothetical operating-loan sizing for a rice budget vs. a soybean budget on the same acreage
What We Found
Missouri's 2026 rice acreage came in below its typical ~200,000-acre, seven-county norm, and USA Rice's own regional contact attributes it to "market issues," not weather — real, current, on-the-record evidence that some version of this pivot is already underway. What's not yet established is the county-level magnitude, or how much of it is being driven by the water table versus the new rice PLC reference price versus soybean demand policy — those three forces point in different directions, which is why this stays "investigating" rather than "answered."
Sources
- linkUSDA NASS — Acreage, June 30 2026
- linkUSDA NASS — Rice Outlook, July 2025
- linkLittle River Drainage District — official history
- linkUSGS/SIU — Aquifer Depletion in the Lower Mississippi River Basin
- linkUSA Rice Federation — Rice Wins with Enactment of the One Big Beautiful Bill Act
- linkAmerican Farm Bureau Federation — Risk Management Options for 2026
- linkHolland & Knight — EPA Final RFS Rule for 2026-2027
- linkfarmdoc daily — U.S.-China Soybean Deal comparison
- linkBrownfield Ag News — Missouri Celebrates Rice Month
- linkNRCS Arkansas — Reducing Groundwater to Increase Sustainable Agriculture