The High Plains Got One Wet Year. Did It Actually Buy Farmers Time?
After Kansas groundwater improved while Nebraska groundwater broadly declined, how should producers, lenders, and processors value irrigation resilience when diesel, electricity, and crop margins are volatile?
Short Answer
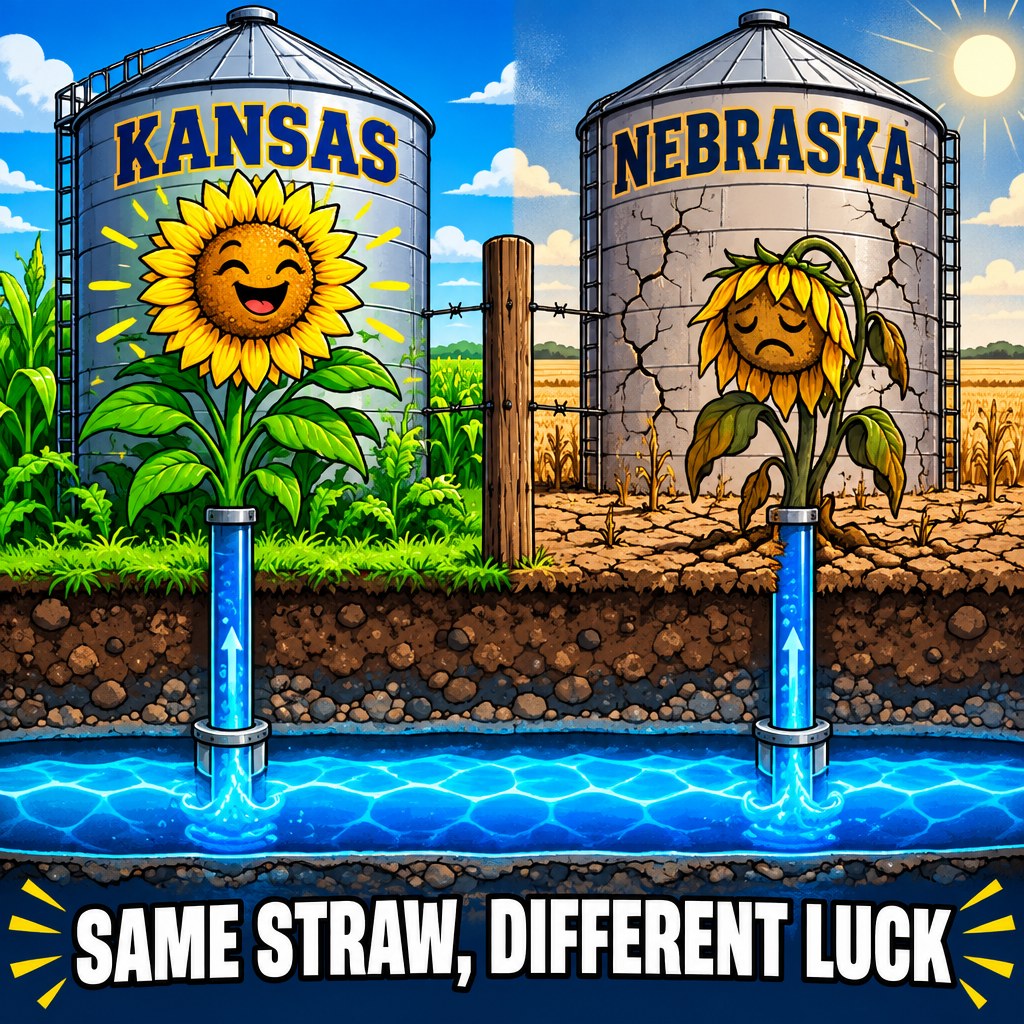
Kansas got genuinely good groundwater news this year — its first statewide High Plains aquifer increase since 2019. Nebraska, sharing the same aquifer system one state line north, got the opposite. Neither number means what a single headline would make it mean. A wet year that lets an irrigator pump less isn't the same thing as structural aquifer recovery, and a decline that looks alarming in isolation might be perfectly manageable if that acre's energy costs and crop economics still work. Status: investigating — the direction of the water is verified; the direction of the money isn't, yet.
Two States, One Aquifer, Two Different Years
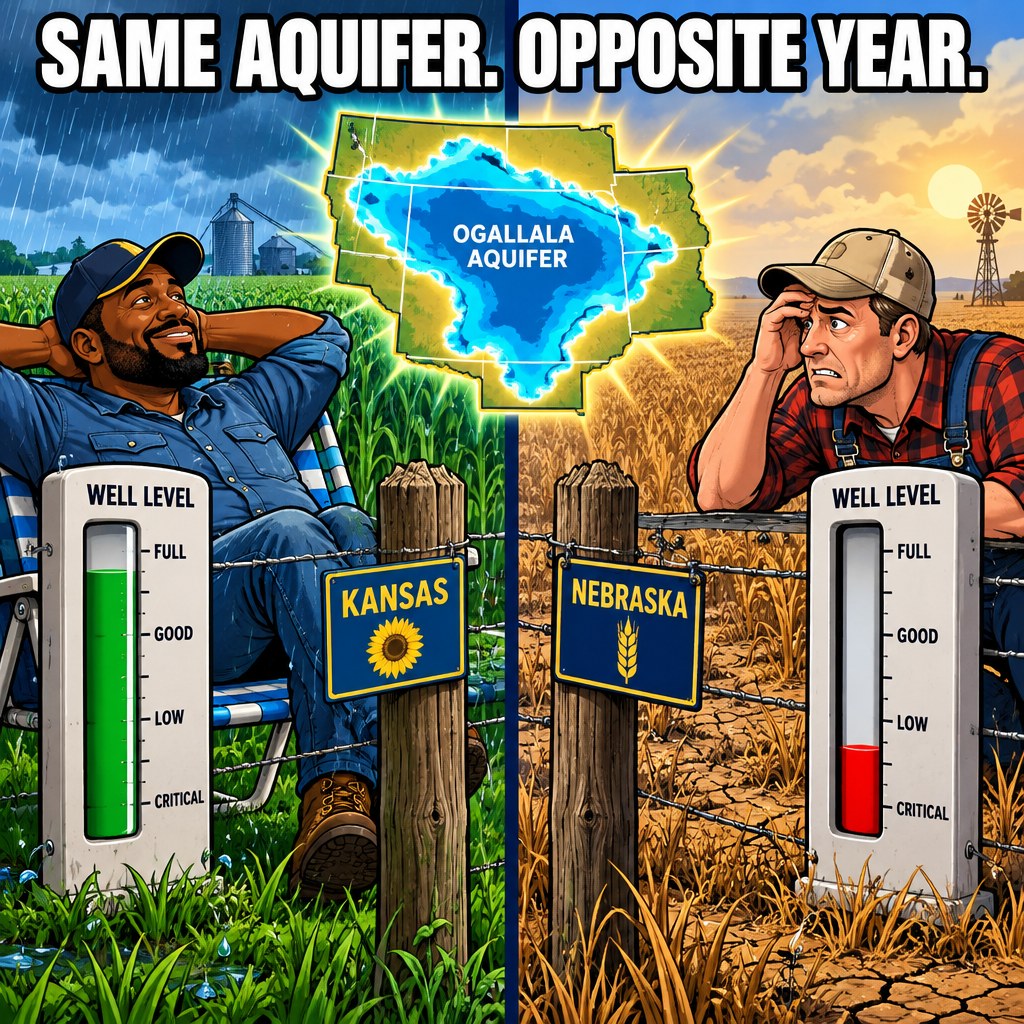
The High Plains (Ogallala) aquifer doesn't respect state lines, but state-level reporting does. In 2025, the Kansas Geological Survey measured the first overall statewide increase in the Kansas High Plains aquifer since 2019 — driven by wetter conditions that let farmers pump less. South-central Kansas, in the Great Bend Prairie and Equus Beds portions of the aquifer, saw water levels rise nearly 2.5 feet on average, helped by sandy soils and a shallow water table that recharges fast when the rain actually comes. Western Kansas wasn't uniform: west-central Kansas and Groundwater Management District 1 saw a slight rise, while northwest and southwest Kansas kept declining — just by less than the long-term average. (Kansas Geological Survey — "Groundwater levels in the Kansas High Plains aquifer see first overall increase since 2019")
Nebraska's 2026 statewide report tells almost the opposite story. The University of Nebraska–Lincoln's Conservation and Survey Division measured nearly 5,000 wells between spring 2024 and spring 2025 and found groundwater levels declined on average by 0.29 feet, with 62% of measured wells showing a decline. The worst of it — declines exceeding 10 feet — sits in the Nebraska Panhandle, an area running through persistent multi-year drought. Nebraska manages this through 23 Natural Resources Districts, each running its own regional groundwater management plan; the state's monitoring itself calls the Panhandle trend "a persistent concern worthy of public awareness." (University of Nebraska–Lincoln IANR — "Groundwater levels continue to decline amid persistent drought conditions")
Why the Economic System Is Bigger Than the Aquifer Chart
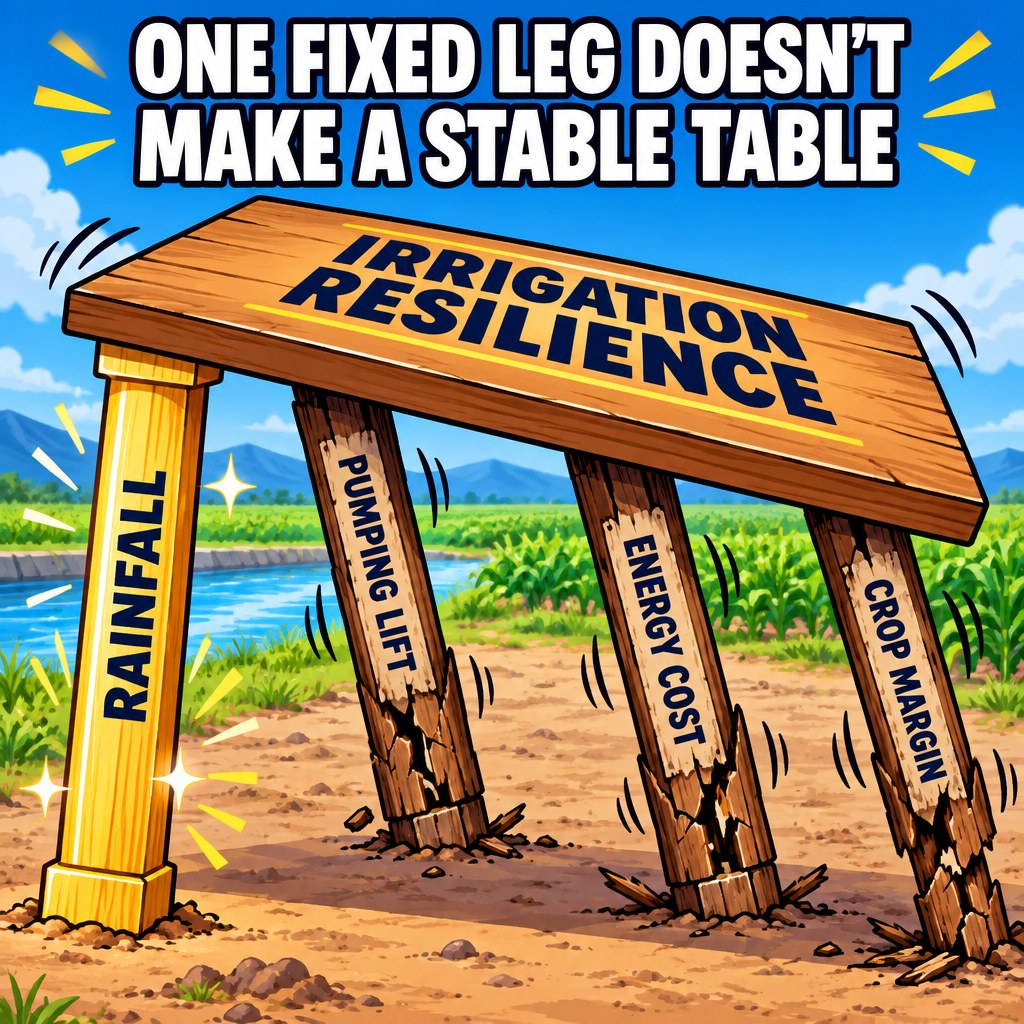
Here's the trap in reading either number by itself: an acre's actual resilience depends on more than whether the water level moved up or down. Pumping lift — how far the water has to travel to reach the surface — determines how much energy it takes to irrigate that acre at all. Energy source (electric grid power versus a diesel-fired pump) determines how exposed that lift is to a fuel-price shock like the one we've documented in the Bootheel this same week. Crop choice determines how much revenue that water buys per unit pumped. And a lender's geography determines whether a physical water shock ever becomes a credit event, or just gets absorbed. A wet year can improve one edge of that system — recharge — while leaving every other edge exactly as fragile as it was.
How This Connects
open_with Drag nodes to rearrange, tap one for the evidence behind it — pinch or scroll to zoom.
The Numbers So Far
Nebraska's Panhandle, specifically, is the outlier worth watching: declines there exceeded 10 feet, more than 30 times the statewide average decline. That's the kind of number that changes what a specific district's producers, lenders, and processors should actually be modeling — not the tamer statewide 0.29-foot figure.
Where This Is Happening
Methodology
This pass relied on two university/state geological-survey primary sources — the Kansas Geological Survey's 2025 High Plains aquifer measurement and the University of Nebraska-Lincoln's spring 2024–2025 statewide well survey — cross-referenced against the same national diesel-price shock documented in our companion Bootheel investigation. It explicitly did not yet acquire: farm- or district-level pumping-lift data, the electric-versus-diesel energy mix by irrigation district, enterprise-budget crop margins under this year's specific energy prices, or any lender/processor interview. Those are exactly the inputs the planned Water-Energy-Agriculture Resilience GIS artifact needs before this becomes more than a directional finding.
Moral of the Story
If you're a Kansas irrigator in a recovering district: don't read one wet year as permission to expand pumping back to pre-drought levels — ask your Groundwater Management District whether this year's rise reflects real recharge or just reduced pumping, because those have very different implications for next year.
If you're a Nebraska producer in the Panhandle: the >10-foot decline in your district is a genuinely different risk category than the statewide 0.29-foot average — don't let a statewide headline undersell what your specific Natural Resources District is already tracking.
If you're a lender covering either state: pumping lift and energy-mix data don't currently sit next to your crop-collateral models in one place. That's a real, buildable gap, and the region that closes it first gets a genuine underwriting edge.
Related Research
This connects to our investigation into what the September 2026 diesel shock costs a Bootheel farm — the same energy-price event, a completely different water-and-pumping context.
Where This Stands
Investigating
Our Best Guess So Far
Recent groundwater improvement buys meaningful economic resilience only where pumping lift, energy exposure, and crop-market economics also remain favorable — a regional-average water-level change alone will overstate resilience in some places and understate it in others. This is a hypothesis to test against district-level pumping-lift and energy-mix data, not a conclusion.
What Got Us Asking This
- linkKansas Geological Survey — 2025 High Plains aquifer report — First overall statewide increase in the Kansas High Plains aquifer since 2019; south-central Kansas (Great Bend Prairie / Equus Beds) rose ~2.5 ft on average, driven by wetter conditions reducing pumping. Northwest/southwest Kansas kept declining, but less than the long-term average.
- linkUniversity of Nebraska-Lincoln IANR — 2026 statewide groundwater report — Nearly 5,000 wells measured spring 2024-2025; statewide average decline of 0.29 ft, 62% of wells declined; Nebraska Panhandle saw declines exceeding 10 ft, the worst in the state.
How This Connects
The Physical Side
Aquifer/well/pump/irrigated-field/crop/processor chain — Kansas and Nebraska moved in opposite directions in the same reporting year, within the same broader High Plains aquifer system.
The Money Side
Water-energy cost feeds farm operating margin, asset value, and ultimately lender credit risk — the same mechanism our Bootheel diesel investigation traces for a different commodity and a different water context.
The Day-to-Day Work
Producers, Groundwater Management Districts / Natural Resources Districts, utilities, and ethanol/feedlot/elevator operators all set the rules, demand, and contracts that turn a water-level number into a production decision.
The Data/Systems Side
Kansas Geological Survey, University of Nebraska-Lincoln, USDA NASS, and Extension enterprise budgets each publish on different cadences and geographies — no single source currently joins water trajectory, energy exposure, and crop economics into one model.
Who We'd Like to Talk To
- Kansas and Nebraska irrigated-row-crop producers
- Kansas Groundwater Management Districts
- Nebraska Natural Resources Districts
- Agricultural lenders covering irrigated ground in both states
- K-State/UNL farm-management economists
- Ethanol, feedlot, and elevator operators in the region
What We Still Need
- Farm- or district-level pumping lift (depth to water) for both states
- Electric-versus-diesel energy mix by irrigation district
- Enterprise-budget crop margins under this year's specific energy prices
- Processor/ethanol/feedlot throughput and demand data by district
- A direct conversation with a Kansas GMD, Nebraska NRD, or regional lender — zero interviews conducted so far
What We'll Build From This
- Water-Energy-Agriculture Resilience GIS — a resilience quintile map, county/district scorecards, and sensitivity curves joining groundwater trajectory, pumping-energy sensitivity, and crop-market access into one evidence-labeled graph
What We Found
Kansas and Nebraska's 2026 groundwater trajectories are fully verified and genuinely opposite — a real, sourced divergence within the same High Plains aquifer system in the same reporting year. What isn't yet established is how that translates into farm-level economic resilience once pumping lift, energy source, and crop-market conditions are actually factored in; that requires district-level data this pass did not acquire, which is why status stays "investigating."