Wisconsin Makes 25% of U.S. Cheese. Where Does the Next Dollar of Dairy Processing Capital Earn the Most?
Wisconsin dairy processors have committed $1.13 billion across 15 capacity projects through 2028, concentrated in cheese/cut-and-wrap rather than whey/ingredients — and Canada's new retaliatory tariff schedule taxes those two categories at different rates (25% cheese vs. 50% whey/powder). Does that capital allocation reflect deliberate risk positioning, and which investment category actually produces the strongest processor and farm resilience per dollar?
Short Answer
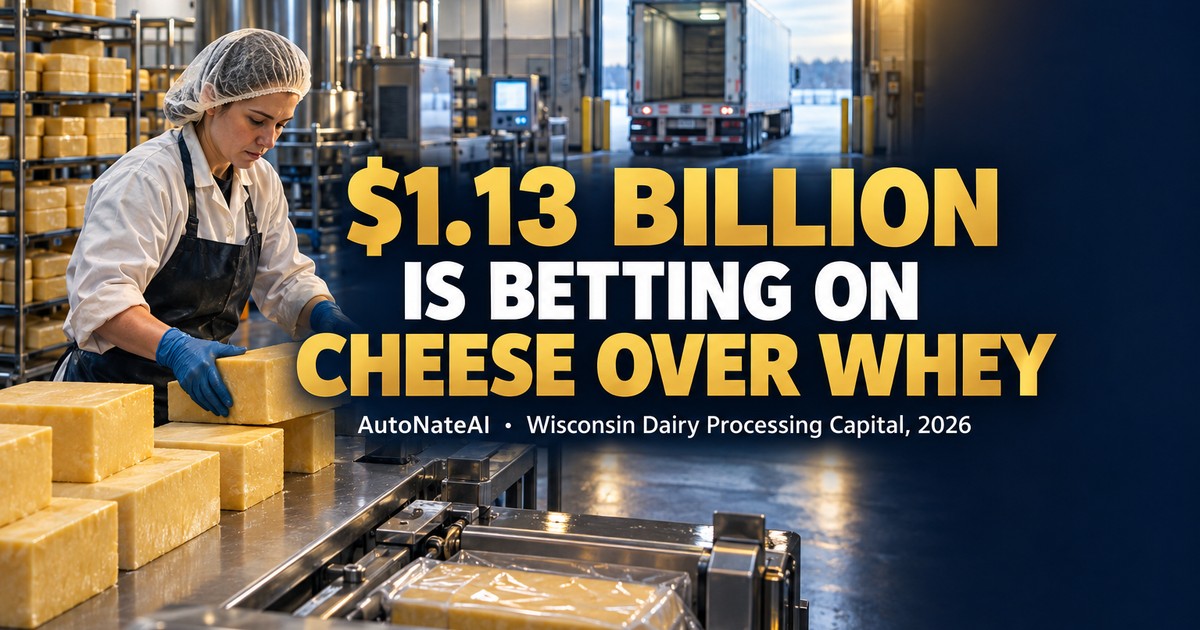
Wisconsin's dairy processors are in the middle of a genuinely large bet — $1.13 billion committed across 15 capacity projects coming online through 2028 — and almost all of it ($950 million-plus) is going into cheese production and cut-and-wrap capacity, not whey and dairy-ingredient plants ($151 million) or anything else. That allocation was decided before Canada's retaliatory dairy tariffs took effect this September, and the tariff schedule that actually landed doesn't treat those two capacity classes the same way: cheese crossing into Canada now faces a 25% tariff, while whey, milk powders, casein, and milk protein concentrate face 50%. So the state's capital is concentrated in the category facing the *lighter* of the two new tariff walls — which could read as smart positioning or as pure coincidence, and public data can't yet tell you which. What I can tell you with real numbers: the public grant programs everyone talks about — DATCP's Dairy Processor Grant, the Dairy Business Innovation Alliance — are a rounding error next to the private capital actually moving. Status: investigating.
Wisconsin Didn't Become "America's Dairyland" by Accident, and the Marketing Predates the Milk
The nickname is older than most of the plants running today. Wisconsin's dairy industry professionalized fast in the late 1800s specifically because the state's own agricultural establishment pushed farmers away from wheat monoculture — which was wearing out the soil — and toward dairy cattle, building out a cooperative creamery system county by county. By the time "America's Dairyland" showed up on license plates in 1940, the state already had the cheesemaking infrastructure, the licensing regime, and the cooperative ownership culture that still define the industry today: nearly 1,200 licensed cheesemakers, producing more than 600 named cheese types, styles, and varieties — almost double any other state. That density of small, specialized, often family-owned cheesemaking operations is exactly why "processing capital allocation" isn't an abstract finance question here. It's a question about which of a very large number of real, differently-sized plants gets the next dollar.

How This Connects
open_with Drag nodes to rearrange, tap one for the evidence behind it — pinch or scroll to zoom.
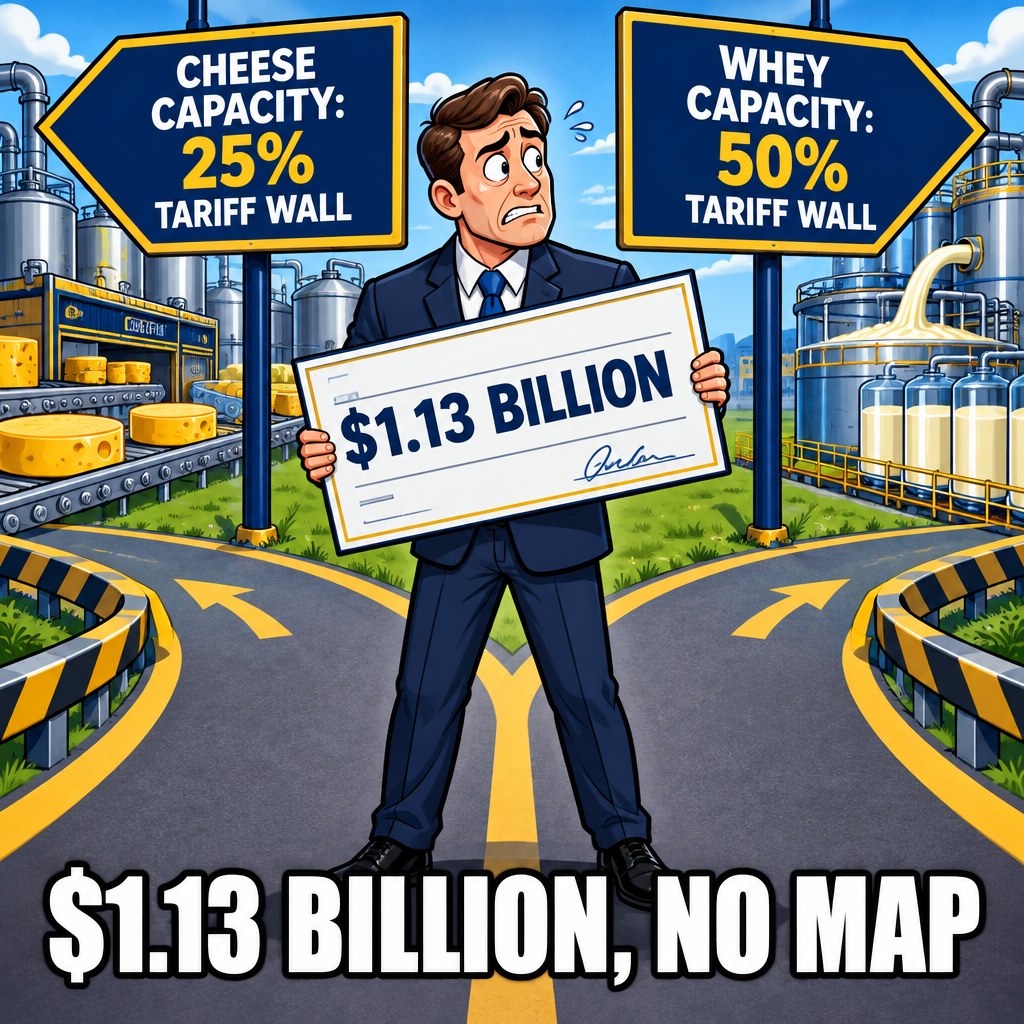
Read the diagram plainly and the tension is this: Wisconsin's processors placed a $1.13 billion bet on cheese and cut-and-wrap capacity before anyone knew Canada's retaliation would specifically go easier on cheese than on whey. That's either a lucky break in the risk math or no risk math at all — and nobody's published which.
Two Trade Policies, Aimed at the Same State, Pointing Different Directions
This is the real policy tension worth naming, because it's not abstract — it's two federal-level trade actions landing on the same state's dairy sector within three weeks of each other. On July 20, 2026, the President signed Section 338 Tariff Act proclamations imposing new U.S. tariffs on Canadian dairy (effective August 19: 50% on Canadian whey, milk proteins, lactose, casein, and milk powders). Canada announced retaliation on August 25 covering CAD $27.6 billion of U.S. goods, with its own dairy-specific tariffs — 25% on U.S. cheese, 50% on U.S. milk powders, whey, casein, and milk protein concentrate — taking effect September 8. (UW-Madison Extension Farm Management — Canada's 2026 Retaliatory Dairy Tariffs)
At the same moment, the state's own DATCP is running the opposite motion: it opened its 2026 Dairy Processor Grant window (through November 3, 2026) with expanded funding from a bipartisan 2025-2027 biennial budget deal specifically meant to help processors invest in modernization, food safety, and expansion. (DATCP — Dairy Processor Grant Applications) One federal lever is actively taxing Wisconsin's export product on the way out. One state lever is actively subsidizing the capacity that makes more of it. Both are real, both are current, and neither is sized to cancel the other out — DATCP's entire program has funded $3.2 million since 2014; UW Extension's own anchor estimate puts the tariff's annual cost to Wisconsin dairy farmers at $65-$113 million, every year the tariff holds.

The Numbers So Far
Three honest reads: the state's real capital is overwhelmingly betting on cheese, not on the ingredients side of the plant. The new tariff schedule happens to hit that same ingredients side twice as hard. And the actual dollar cost of the trade shock — tens to low hundreds of millions a year, by UW Extension's own range — dwarfs every public grant dollar meant to help processors adapt.
Where This Is Happening
What the Trade Association Representing These Plants Hasn't Said Publicly Yet
The Wisconsin Cheese Makers Association is the one organization positioned to actually answer this article's core question — it represents more than 900 member organizations, including 62 dairy manufacturers operating 82 cheese and butter plants plus 25 further-processors, the exact population whose capex decisions this piece is trying to evaluate. (Wisconsin Cheese Makers Association — Membership) As of this research pass, WCMA hasn't published a statement connecting its members' capacity-expansion decisions to the new Canada tariff schedule specifically, or ranking which capex category its members consider most exposed. That's not a criticism — the tariff took effect September 8, barely two weeks before this research pass — but it's the actual gap: the organization with the clearest view into real plant-level decisions hasn't yet said, in public, whether the industry sees its own capital allocation as well-positioned for this tariff shock or simply lucky.
Methodology
This pass drew on Wisconsin DATCP's own cheese-production and export statistics, the Wisconsin Farmer's October 22, 2025 reporting on the $1.13B processor capex wave (sourced to processor announcements, not an independent audit), DATCP's Dairy Processor Grant program pages, the Dairy Business Innovation Alliance's public grant totals, and UW-Madison Extension Farm Management's September 2026 tariff-impact analysis (itself built on a revenue-spread method, Class III pricing-formula translation, and a scaled version of a published 2025 econometric model). It does not include: plant-level capital-expenditure or ROI data for any specific processor, a WCMA or DBIA statement connecting capex category to tariff exposure, Compeer Financial's or BMO's own underwriting criteria for dairy-processor capex loans, or confirmation of how much of the $1.13B has actually been spent versus merely announced. The UW Extension tariff-impact figures are a farm-gate milk-price model, not a processor-margin or plant-cash-flow model — a genuinely different number this pass didn't find published anywhere.
Moral of the Story
If you're a Wisconsin dairy processor mid-decision on a capex project right now, the concrete question worth asking your own trade team isn't "is this a good investment" in the abstract — it's what share of this specific project's output is destined for Canada, and whether that share sits in the 25% cheese bucket or the 50% whey/powder bucket. That's a five-minute internal exercise most plants can actually run today, using data this article just laid out.
If you're Compeer Financial, BMO, or another dairy-processor lender, the differential tariff exposure by product category is a variable that belongs in underwriting now, not after the next round of financials comes in — a whey-heavy borrower's Canada-exposed revenue just got hit twice as hard as a cheese-heavy borrower's did, and that's public information as of September 8.
If you're WCMA or DBIA, the honest, useful thing to publish next isn't another modernization-grant announcement — it's a members' survey of how much export revenue by product category is actually Canada-destined, which would turn this article's open question into a real, sourced answer.
If you're a dairy farmer wondering why your own milk check might be smaller this fall, UW Extension already ran the number for you: $0.20-$0.35 less per hundredweight in the anchor scenario, worth asking your co-op or processor directly whether they're seeing it yet.

Related Research
This is the first flagship investigation into Wisconsin's dairy economy on this site — future passes should follow the same trade-tariff thread into farm-level milk pricing and processor-specific capex outcomes as they become public. The structured fields below (who we'd like to talk to, what we still need, our sources) carry the parts of this investigation that update independently of the write-up above.
Where This Stands
Investigating
Our Best Guess So Far
Wisconsin's $1.13B private capex wave is concentrated in cheese/cut-and-wrap capacity ($950M+) over whey/ingredients capacity ($151M). Canada's new retaliatory tariff schedule taxes cheese at 25% and whey/milk-powder/protein products at 50% — meaning the category holding the large majority of new capital investment also happens to face the lighter tariff. If this is deliberate risk positioning by processors, it would be a genuinely sophisticated read of trade risk made well before the tariff was announced; if it's coincidental (cheese capacity simply being the larger, more established category processors default to expanding), that's a different and less flattering story. Public data can't yet distinguish the two — that's a hypothesis, not a finding.
What Got Us Asking This
- linkWisconsin DATCP — 2025 dairy statistics — Wisconsin produced 3.64 billion pounds of cheese in 2025 — 25% of U.S. cheese production — and exported $3.99B in agricultural/food products to 148 countries, the third-highest total on record.
- linkWisconsin Farmer — Wisconsin dairy processors investing $1.1B in 15 projects (Oct 22, 2025) — $1.13B across 15 capacity projects, 2025-2028: $950M+ cheese/cut-and-wrap, $151M whey/dairy-ingredients, $23M condensed milk.
- linkUW-Madison Extension Farm Management — Canada's 2026 Retaliatory Dairy Tariffs — Canada's Sep 8, 2026 retaliatory tariffs: 25% on U.S. cheese, 50% on U.S. milk powders/whey/casein/MPC. Anchor estimate: $0.20-$0.35/cwt Wisconsin milk-price reduction, $65-$113M/year statewide, $51-$90/cow.
- linkDATCP — 2026 Dairy Processor Grant Applications — Grants up to $50,000/project, 20% match required; since 2014, 135 of 267 proposals funded, totaling $3.2M.
- linkDairy Business Innovation Alliance — Nearly $24M across 300+ grants to Midwest dairy businesses since the 2018 Farm Bill created the program; $1.7M 'Business Builder' pool in 2026.
- linkWisconsin Cheese Makers Association — Membership — 900+ member organizations, including 62 dairy manufacturers operating 82 cheese/butter plants plus 25 further-processors.
How This Connects
The Physical Side
Milk from Wisconsin dairy farms → cheese/cut-and-wrap plants (the $950M+ capex slice) and whey/ingredients plants (the $151M slice) → domestic and export markets, ~90% of state milk becoming cheese.
The Money Side
$1.13B in private processor capex (2025-2028) dwarfs $3.2M in cumulative DATCP Dairy Processor Grants (since 2014) and ~$24M in cumulative DBIA grants — public capital functions as a small match-funding layer, not the primary driver of the capacity wave.
The Day-to-Day Work
Processors (WCMA's 900+ member network) make the capex decisions; Compeer Financial and BMO underwrite processor capital; DATCP and DBIA administer the grant layer; Canada's government sets the new tariff schedule these decisions now sit inside.
The Data/Systems Side
Public data covers aggregate capex-by-category, aggregate grant totals, and a statewide farm-level tariff-impact model. It does not cover plant-level ROI, processor-specific Canada-export exposure, or a WCMA/DBIA statement connecting the two.
Who We'd Like to Talk To
- Wisconsin Cheese Makers Association (John Umhoefer, Executive Director)
- Compeer Financial
- BMO / Betsy Erdelyi
- DATCP Dairy Processor Grant program staff
- Dairy Business Innovation Alliance
- Dairy Farmers of Wisconsin
- Center for Dairy Research
What We Still Need
- Plant-level capital expenditure and cash-return data by investment category (throughput, automation, wastewater/energy, value-added conversion, cold storage, export enablement)
- A WCMA or DBIA member survey connecting capex category to Canada-export revenue share
- Compeer Financial's or BMO's underwriting criteria for dairy-processor capex loans, and whether tariff exposure by product category factors in
- Confirmation of how much of the announced $1.13B has actually been spent vs. merely committed
- A processor-margin or plant-cash-flow model translating UW Extension's farm-gate milk-price impact into processor-level terms
What We'll Build From This
- A capex-category-by-tariff-exposure matrix once plant-level export-destination data exists
- A tracker comparing DATCP/DBIA grant recipients' project categories against the private capex wave's category mix
What We Found
The capital-allocation pattern is real and verified: Wisconsin processors have committed $950M+ of a $1.13B capex wave to cheese/cut-and-wrap capacity versus $151M to whey/ingredients, and Canada's Sep 8, 2026 retaliatory tariff schedule taxes those two categories at 25% and 50% respectively — meaning the larger capital bet sits behind the lighter tariff wall. What's not yet verified is whether that's deliberate risk positioning or coincidence, because no processor, WCMA, or DBIA statement has connected the two publicly, and plant-level ROI/export-exposure data isn't public. Also verified: public grant capital (DATCP + DBIA, roughly $27M combined since program inception) is a small fraction of the private capex wave and an even smaller fraction of UW Extension's own $65-$113M/year anchor estimate for the tariff's annual cost to Wisconsin dairy farmers. Status stays investigating.
Sources
- linkWisconsin DATCP — Export Statistics
- linkWisconsin Farmer — Wisconsin dairy processors investing $1.1B in 15 projects
- linkUW-Madison Extension Farm Management — Canada's 2026 Retaliatory Dairy Tariffs
- linkDATCP — 2026 Dairy Processor Grant Applications
- linkDairy Business Innovation Alliance
- linkWisconsin Cheese Makers Association — Membership Information