Delmarva Produces 40% More Chicken With 37% Fewer Growers Than 20 Years Ago. Who Captures the Productivity Gain?
How has Delmarva increased chicken output while the number of growers fell sharply over two decades, and how are productivity gains, contract income, processing capital, feed demand, disease risk, and bargaining power distributed across growers and integrated poultry companies?
Short Answer
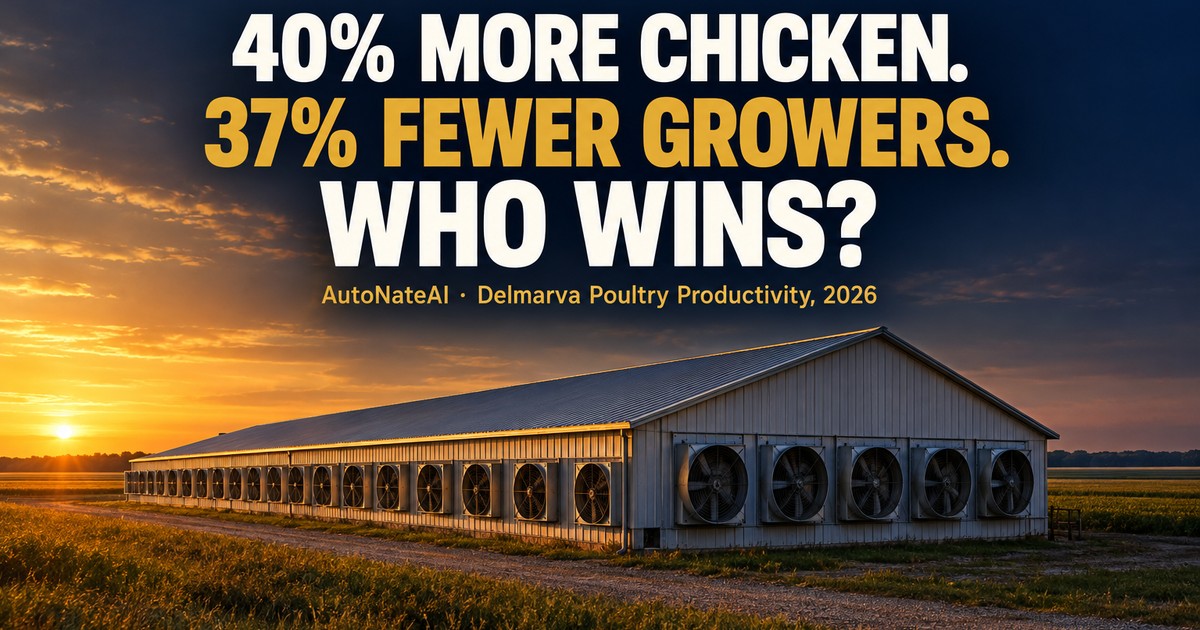
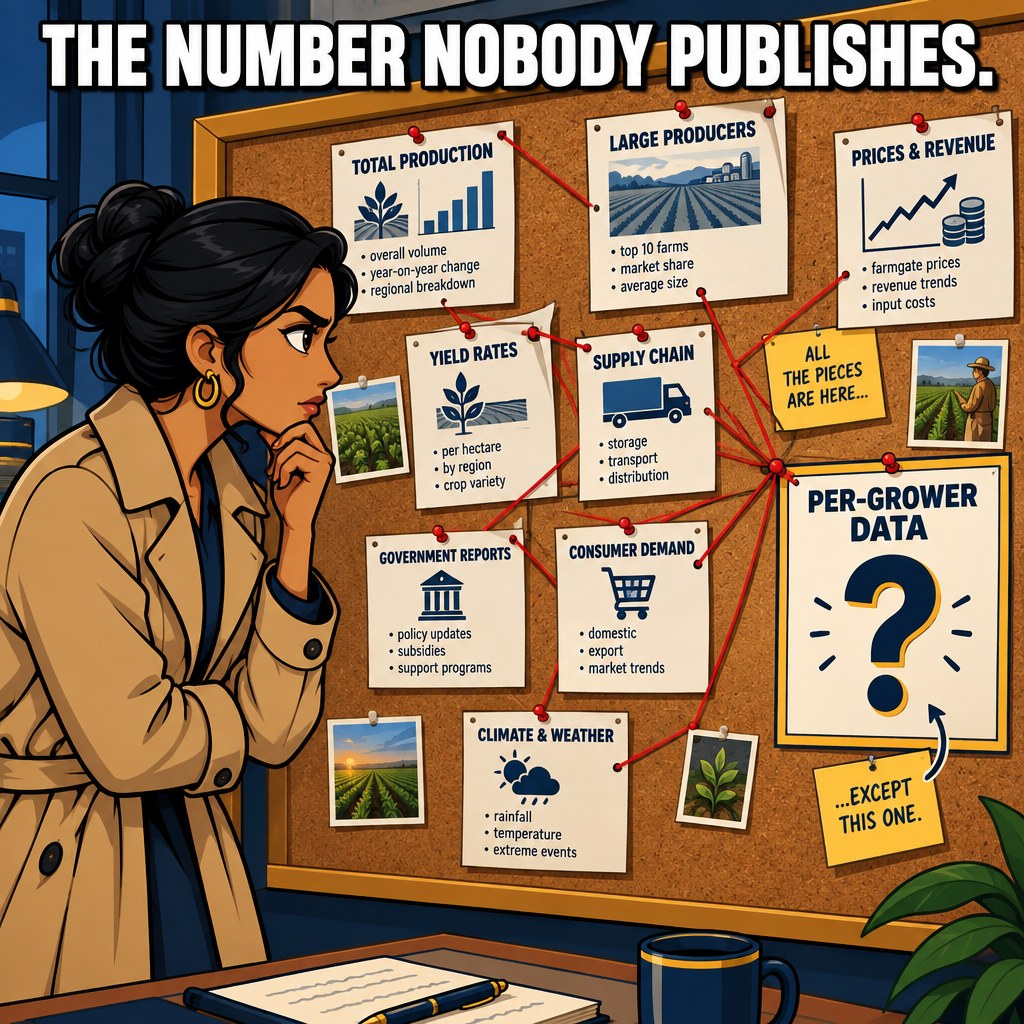
The Delmarva Chicken Association's own numbers say it plainly: the peninsula raised 628 million chickens and produced 4.7 billion pounds of chicken in 2025, up 40.5% from 20 years ago — while the number of contract growers fell 36.8% to 1,225 and the number of chicken houses fell 11.3% over the same stretch. Grower contract income, as a total pool, rose 27.4% in inflation-adjusted terms across those same 20 years. Put those two disclosed numbers next to each other and something interesting falls out: if you divide today's contract-income pool by today's much smaller grower count, the implied average per-grower share has roughly doubled in real terms since 2005 — a genuinely striking number, and one DCA doesn't publish directly, so treat it as a calculation, not an official finding. What the public data can't yet tell you is where that gain actually came from — bigger houses, more flock cycles per year, better genetics, tighter processor coordination, or some mix — or how much of it required capital most growers had to take on debt to access. Status: investigating.

The Industry That Started With One Woman's Accidental Order
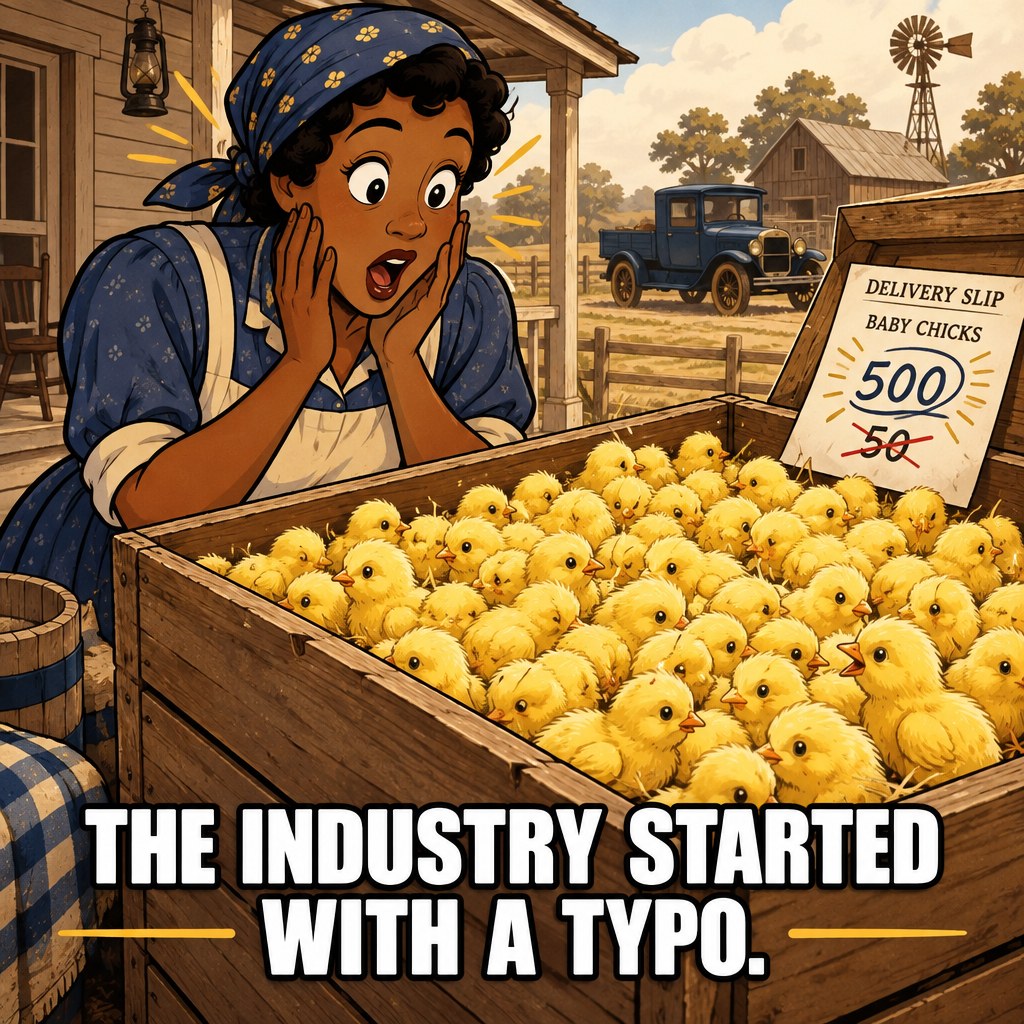
Delmarva isn't just *a* place with a big chicken industry — it's arguably where the modern American broiler industry itself began. In 1923, in Ocean View, Delaware, a farmer named Cecile Steele reportedly received an order of 500 baby chicks instead of the 50 she'd meant to order for egg production, raised them for meat instead, and sold them at a healthy profit — a small accident credited as the spark that turned the peninsula's farmers toward chicken-for-meat production at scale, decades before "broiler" was a standard term. A century later, that same peninsula runs on a structure almost nobody in 1923 would recognize: three large, vertically integrated companies — Perdue Farms (Salisbury, Maryland, founded 1920), Mountaire Farms (Millsboro, Delaware, founded 1914, still family-owned), and Allen Harim — contract with a shrinking number of independent family farms to raise company-owned birds in company-specified houses, on a schedule and to specifications set well upstream of any individual grower. (Perdue Farms corporate history; Mountaire Farms — About Us)
How This Connects
open_with Drag nodes to rearrange, tap one for the evidence behind it — pinch or scroll to zoom.
That last dashed edge is the whole point of this diagram. DCA discloses the 20-year pool-income change and the 20-year grower-count change as two separate, real, verified facts — but nobody publishes the number you get from dividing one by the other, which is the number that would actually tell you whether the average remaining grower is meaningfully better off than their counterpart 20 years ago. I did that division in the Short Answer above and I'm showing my work here rather than passing it off as an official DCA statistic.
The Federal Layer Most People Don't Connect to a Chicken Sandwich
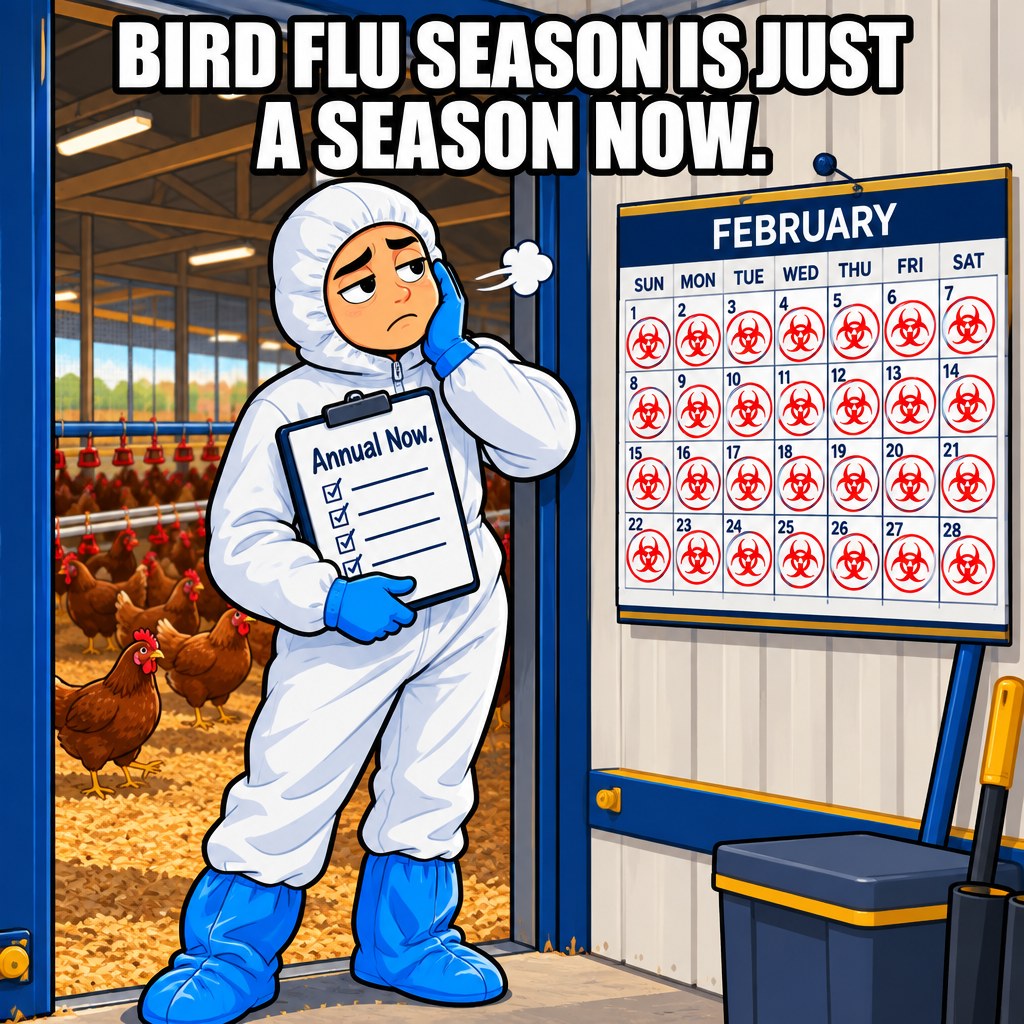
Two federal-level forces touch this system in very different ways. First, USDA's Natural Resources Conservation Service runs cost-share programs — including active Maryland work demonstrating alternative containment structures for stockpiling poultry litter during the periodic whole-house cleanouts every Delmarva chicken house needs every two to three years — that help growers manage a genuine environmental cost of scale that predates and outlasts any single company's capital budget. (USDA NRCS — Demonstration of Alternative Containment Structures for Stockpiling Poultry Litter) Second, and much more immediate: state agriculture departments confirmed presumptive HPAI cases on two Caroline County, Maryland broiler farms on consecutive days in late February 2026, with a Kent County, Delaware case around the same window — and Maryland officials and industry voices were already describing this kind of recurring seasonal detection as a "new normal" for the Eastern Shore. (Maryland Department of Agriculture, Feb 25-26 2026 press releases) A disease risk that's shifted from occasional emergency to expected annual cost is exactly the kind of thing that plausibly favors whichever growers and companies have the capital to keep investing in biosecurity — though DCA's own figures don't break out how much of the $267 million in 2025 capital spending was HPAI-driven specifically.
The Numbers So Far
Read the second chart carefully: grower contract income is the smallest of the four disclosed dollar figures, well behind even feed purchases — but that comparison alone doesn't tell you whether growers are underpaid, since it doesn't include what companies keep as profit (not disclosed) or what growers had to borrow to build the houses that let them participate at all (also not disclosed).
Where This Is Happening
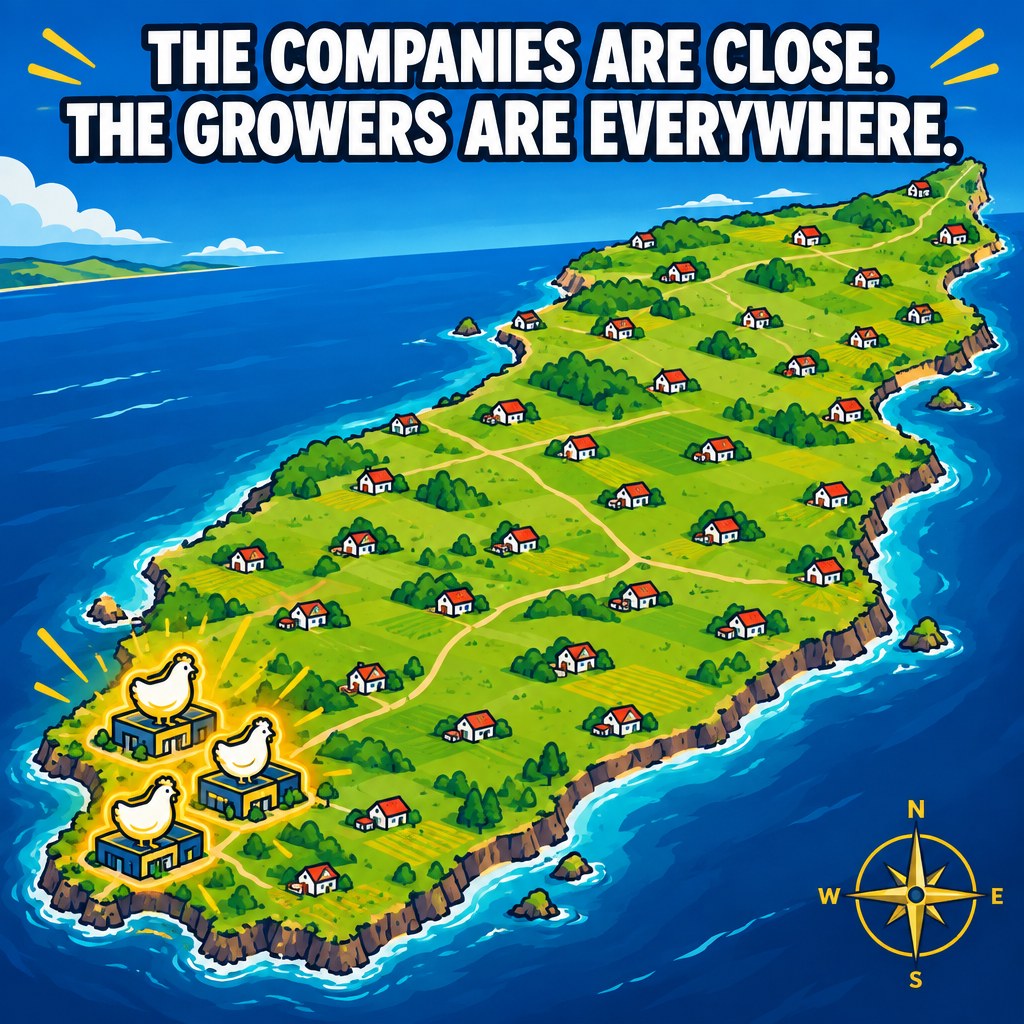
Both headquarters sit within about 25 miles of each other on the peninsula, which is itself a useful fact: the entire structure this article describes — the processing plants, the hatcheries, the feed mills, the 1,225 growers under contract to them — runs inside a genuinely small, dense geographic footprint, not a sprawling national supply chain.
Methodology
This pass relied on the Delmarva Chicken Association's own 2025 Facts & Figures page (fetched directly, not summarized secondhand), Maryland Department of Agriculture press releases on the February 2026 HPAI detections, Perdue Farms' and Mountaire Farms' own corporate history/about pages, and USDA NRCS's public poultry-litter conservation program page. It does not include: grower-level capital cost or debt data for house construction/upgrades, any direct breakdown of the $267 million 2025 capital-improvement figure by purpose (biosecurity vs. capacity vs. routine maintenance), company-level profit or margin data for Perdue, Mountaire, or Allen Harim, feed-conversion or flock-cycle trend data that would explain the *mechanism* behind the 40.5% output increase, or a single direct conversation with DCA, a processor, or a Delmarva contract grower. The "per-grower share roughly doubled" figure in the Short Answer and the graph above is explicitly a derived calculation from two DCA-published aggregate numbers, not a DCA-verified statistic — treat it as a hypothesis worth testing against real grower-level data, not a finding.
Moral of the Story
The headline productivity numbers here are real, DCA-verified, and genuinely impressive — 40% more chicken from a peninsula with over a third fewer growers is a real efficiency story. What's still open is who actually captured that gain, and that question matters differently depending on where you sit:
- If you're a current Delmarva contract grower, the "per-grower share roughly doubled" calculation in this article is worth testing against your own numbers, not taking on faith — DCA's aggregate figures can't tell you whether *you* specifically are ahead of where a grower was 20 years ago, especially net of house-upgrade debt service.
- If you're a grower considering entering or exiting the system, the house count fell 11.3% while output rose 40.5% — that gap is almost certainly capital intensity (bigger, more efficient houses), which means the entry cost for a new grower today is very likely higher, in real terms, than it was 20 years ago, even though this article can't yet put a number on it.
- If you're a lender financing grower operations, HPAI has apparently moved from emergency to expected annual cost on the Eastern Shore — worth underwriting biosecurity capital needs as a recurring line item, not a one-time contingency.
- If you're in economic development or policy, USDA NRCS's poultry-litter cost-share work is a real, existing lever for managing the environmental side of this consolidation story — worth knowing about and pointing growers toward, rather than assuming environmental compliance costs fall on growers alone.
The honest bottom line: this article can tell you the system got dramatically more productive with far fewer growers holding it up. It can't yet tell you, with real data instead of arithmetic, whether the growers who remain are actually winning.

Related Research
This investigation is the first flagship piece on this site to examine the Delmarva Peninsula — the structured fields below (who we'd like to talk to, what we still need, our sources) carry the parts of this investigation that update independently of the write-up above.
Where This Stands
Investigating
Our Best Guess So Far
Output growth with fewer growers/houses likely reflects higher house capacity, bird cycles, genetics, feed conversion, and processor coordination, but public aggregate data cannot assign causality or confirm whether the average remaining grower's real economic position actually improved as much as a naive pool-income/headcount calculation implies. This is a hypothesis to test against grower-level capital, debt, and income data, not a conclusion.
What Got Us Asking This
- linkDelmarva Chicken Association — 2025 Facts & Figures — 628M chickens, 4.7B pounds, $4.6B sales, 1,225 growers, 4,814 houses, $347M grower contract income, $999M employee wages, $1.2B feed purchases, $267M capital improvements. 20-year change: pounds +40.5%, growers -36.8%, houses -11.3%, grower contract income +27.4% inflation-adjusted.
- linkMaryland Department of Agriculture — HPAI Caroline County press releases, Feb 25-26 2026 — Two presumptive HPAI cases confirmed on Caroline County, MD broiler farms on consecutive days, alongside a Kent County, DE detection — described by officials/industry as a recurring 'new normal' for the Eastern Shore.
- linkPerdue Farms and Mountaire Farms corporate history — Perdue (Salisbury, MD, founded 1920) and Mountaire (Millsboro, DE, founded 1914, still family-owned) are two of the peninsula's major vertically integrated processors alongside Allen Harim.
How This Connects
The Physical Side
Fewer, larger, more capital-intensive chicken houses (down 11.3% in count, up 40.5% in total output over 20 years) run under contract to three integrated processors clustered within ~25 miles of each other on the peninsula.
The Money Side
Processors invested $267M in 2025 capital improvements; growers' own house-construction/upgrade capital and debt levels aren't publicly disclosed anywhere found this pass.
The Day-to-Day Work
DCA, Perdue, Mountaire, Allen Harim, and 1,225 independent grower-businesses each hold a different piece of a system where recurring HPAI risk (Feb 2026 Caroline/Kent County detections) is becoming an annual cost of doing business.
The Data/Systems Side
DCA publishes strong aggregate 20-year figures but no per-grower average — the arithmetic implication (roughly doubled real per-grower share) in this article is a derived calculation, not a DCA-verified statistic.
Who We'd Like to Talk To
- Independent contract growers
- Perdue Farms
- Mountaire Farms
- Allen Harim
- Delmarva Chicken Association
- agricultural lenders
- feed/grain suppliers
- conservation agencies (USDA NRCS)
What We Still Need
- Grower-level house-construction/upgrade capital and debt data
- A breakdown of the $267M 2025 capital-improvement figure by purpose (biosecurity vs. capacity vs. maintenance)
- Company-level profit/margin data for Perdue, Mountaire, and Allen Harim
- Feed-conversion and flock-cycle trend data explaining the mechanism behind the output increase
- A direct conversation with DCA, a processor, or a Delmarva contract grower — zero interviews conducted so far
What We'll Build From This
- Delmarva Grower-Processor Dependency Network — a 20-year structural-trend dashboard with a capex/grower-income scenario model